How to assume Role in AWS CodeBuild running locally

The issue

Testing AWS CodeBuild jobs locally using the AWS CodeBuild agent can save you a lot of time. But I couldn’t find a solution how to use the “famous” API call assumeRole inside of a local AWS CodeBuild run. This can be needed, e.g. if you want to build a Docker image inside of AWS CodeBuild and then upload the image to AWS ECR using temporary credentials. When running such a AWS CodeBuild job in AWS this is not a problem as you can attach an IAM Role to you AWS CodeBuild. On local machine this looks differently as your not running the commands inside of AWS.

The solution

Run assumeRole on your local machine (where you are already logged in to AWS). Then pass the AWS STS credentials to the AWS CodeBuild agent via text file which will be parsed as environment variables then.

Note: passing credentials as environment variables to a Docker image is not secure and suggested. But only for local short-term testing as it was in my case I found this solution acceptable as the credentials didn’t leave my local machine.

So let’s start:

This snippet runs assumeRole and then saves the AWS STS credentials in a textfile creds.txt.

TEMP_ROLE=$(aws sts assume-role \
--role-arn "arn:aws:iam::123456789:role/Role123" \
--role-session-name "ECR" \
--profile NEEDED_IF_NON_DEFAULT_PROFILE_SHOULD_BE_USED)
echo "AWS_ACCESS_KEY_ID=$(echo "${TEMP_ROLE}" | jq -r '.Credentials.AccessKeyId')" > creds.txt
echo "AWS_SECRET_ACCESS_KEY=$(echo "${TEMP_ROLE}" | jq -r '.Credentials.SecretAccessKey')" >> creds.txt
echo "AWS_SESSION_TOKEN=$(echo "${TEMP_ROLE}" | jq -r '.Credentials.SessionToken')" >> creds.txt

Now you can run CodeBuild and pass the txt file, e.g.:

./codebuild_build.sh -i public.ecr.aws/codebuild/amazonlinux2-x86_64-standard:5.0 -a /tmp/tmp_dir -e creds.txt

As the AWS STS credentials are available as environment variables you just have to run the usual command to log in to AWS ECR, e.g.:

aws ecr get-login-password --region eu-west-1 | docker login --username AWS --password-stdin 123456789.dkr.ecr.eu-west-1.amazonaws.com

Then you can build and push your image, e.g.

docker build -t abc:test .
docker tag abc:test 123456789.dkr.ecr.eu-west-1.amazonaws.com/abc:test 
docker push 123456789.dkr.ecr.eu-west-1.amazonaws.com/abc:test

FYI: You can find all supported parameters for the shell script from AWS at: https://github.com/aws/aws-codebuild-docker-images/blob/master/local_builds/codebuild_build.sh

List of AWS Services supported by IAM

This post is different than my usual ones as I’m not writing a solutions guide. Basically I was looking for a complete list (JSON, XML, …) of all AWS Services which I can use in IAM policies. Unfortunately I didn’t find anything. So I coded a small tool which does this for me. I want to share the final JSON file in case somebody needs it, too. There are situations where you would need such a list in case you create IAM policies with many explicit DENY or ALLOW sections.

The JSON is a list of items. Each item is a list of items by itself. The first attribute is the name of the AWS Service and the second attribute is the service prefix you would use when writing IAM policies referencing this AWS Service.

And now that’s the list in JSON format:

[
  [
    "AWS Accounts",
    "account"
  ],
  [
    "Alexa for Business",
    "a4b"
  ],
  [
    "AWS Amplify",
    "amplify"
  ],
  [
    "Amazon API Gateway",
    "execute-api"
  ],
  [
    "AWS App Mesh",
    "appmesh"
  ],
  [
    "AWS App Mesh Preview",
    "appmesh-preview"
  ],
  [
    "AWS AppConfig",
    "appconfig"
  ],
  [
    "Amazon AppFlow",
    "appflow"
  ],
  [
    "Application Auto Scaling",
    "application-autoscaling"
  ],
  [
    "Application Discovery",
    "discovery"
  ],
  [
    "Application Discovery Arsenal",
    "arsenal"
  ],
  [
    "Amazon AppStream 2.0",
    "appstream"
  ],
  [
    "AWS AppSync",
    "appsync"
  ],
  [
    "AWS Artifact",
    "artifact"
  ],
  [
    "Amazon Athena",
    "athena"
  ],
  [
    "AWS Auto Scaling",
    "autoscaling-plans"
  ],
  [
    "AWS Backup",
    "backup"
  ],
  [
    "AWS Backup storage",
    "backup-storage"
  ],
  [
    "AWS Batch",
    "batch"
  ],
  [
    "AWS Billing",
    "aws-portal"
  ],
  [
    "AWS Budget Service",
    "budgets"
  ],
  [
    "AWS Certificate Manager",
    "acm"
  ],
  [
    "AWS Certificate Manager Private Certificate Authority",
    "acm-pca"
  ],
  [
    "AWS Chatbot",
    "chatbot"
  ],
  [
    "Amazon Chime",
    "chime"
  ],
  [
    "Amazon Cloud Directory",
    "clouddirectory"
  ],
  [
    "AWS Cloud Map",
    "servicediscovery"
  ],
  [
    "AWS Cloud9",
    "cloud9"
  ],
  [
    "AWS CloudFormation",
    "cloudformation"
  ],
  [
    "Amazon CloudFront",
    "cloudfront"
  ],
  [
    "AWS CloudHSM",
    "cloudhsm"
  ],
  [
    "Amazon CloudSearch",
    "cloudsearch"
  ],
  [
    "AWS CloudTrail",
    "cloudtrail"
  ],
  [
    "Amazon CloudWatch",
    "cloudwatch"
  ],
  [
    "CloudWatch Application Insights",
    "applicationinsights"
  ],
  [
    "Amazon CloudWatch Logs",
    "logs"
  ],
  [
    "Amazon CloudWatch Synthetics",
    "synthetics"
  ],
  [
    "AWS Code Signing for Amazon FreeRTOS",
    "signer"
  ],
  [
    "AWS CodeArtifact",
    "codeartifact"
  ],
  [
    "AWS CodeBuild",
    "codebuild"
  ],
  [
    "AWS CodeCommit",
    "codecommit"
  ],
  [
    "AWS CodeDeploy",
    "codedeploy"
  ],
  [
    "Amazon CodeGuru",
    "codeguru"
  ],
  [
    "Amazon CodeGuru Profiler",
    "codeguru-profiler"
  ],
  [
    "Amazon CodeGuru Reviewer",
    "codeguru-reviewer"
  ],
  [
    "AWS CodePipeline",
    "codepipeline"
  ],
  [
    "AWS CodeStar",
    "codestar"
  ],
  [
    "AWS CodeStar Connections",
    "codestar-connections"
  ],
  [
    "AWS CodeStar Notifications",
    "codestar-notifications"
  ],
  [
    "Amazon Cognito Identity",
    "cognito-identity"
  ],
  [
    "Amazon Cognito Sync",
    "cognito-sync"
  ],
  [
    "Amazon Cognito User Pools",
    "cognito-idp"
  ],
  [
    "Amazon Comprehend",
    "comprehend"
  ],
  [
    "Comprehend Medical",
    "comprehendmedical"
  ],
  [
    "Compute Optimizer",
    "compute-optimizer"
  ],
  [
    "AWS Config",
    "config"
  ],
  [
    "Amazon Connect",
    "connect"
  ],
  [
    "AWS Connector Service",
    "awsconnector"
  ],
  [
    "AWS Cost and Usage Report",
    "cur"
  ],
  [
    "AWS Cost Explorer Service",
    "ce"
  ],
  [
    "AWS Data Exchange",
    "dataexchange"
  ],
  [
    "Amazon Data Lifecycle Manager",
    "dlm"
  ],
  [
    "Data Pipeline",
    "datapipeline"
  ],
  [
    "AWS Database Migration Service",
    "dms"
  ],
  [
    "Database Query Metadata Service",
    "dbqms"
  ],
  [
    "DataSync",
    "datasync"
  ],
  [
    "AWS DeepComposer",
    "deepcomposer"
  ],
  [
    "AWS DeepLens",
    "deeplens"
  ],
  [
    "AWS DeepRacer",
    "deepracer"
  ],
  [
    "Amazon Detective",
    "detective"
  ],
  [
    "AWS Device Farm",
    "devicefarm"
  ],
  [
    "AWS Direct Connect",
    "directconnect"
  ],
  [
    "AWS Directory Service",
    "ds"
  ],
  [
    "Amazon DynamoDB",
    "dynamodb"
  ],
  [
    "Amazon DynamoDB Accelerator (DAX)",
    "dax"
  ],
  [
    "Amazon EC2",
    "ec2"
  ],
  [
    "Amazon EC2 Auto Scaling",
    "autoscaling"
  ],
  [
    "Amazon EC2 Image Builder",
    "imagebuilder"
  ],
  [
    "Amazon EC2 Instance Connect",
    "ec2-instance-connect"
  ],
  [
    "AWS Elastic Beanstalk",
    "elasticbeanstalk"
  ],
  [
    "Amazon Elastic Block Store",
    "ebs"
  ],
  [
    "Amazon Elastic Container Registry",
    "ecr"
  ],
  [
    "Amazon Elastic Container Service",
    "ecs"
  ],
  [
    "Amazon Elastic Container Service for Kubernetes",
    "eks"
  ],
  [
    "Amazon Elastic File System",
    "elasticfilesystem"
  ],
  [
    "Amazon Elastic Inference",
    "elastic-inference"
  ],
  [
    "Elastic Load Balancing",
    "elasticloadbalancing"
  ],
  [
    "Elastic Load Balancing V2",
    "elasticloadbalancing"
  ],
  [
    "Amazon Elastic MapReduce",
    "elasticmapreduce"
  ],
  [
    "Amazon Elastic Transcoder",
    "elastictranscoder"
  ],
  [
    "Amazon ElastiCache",
    "elasticache"
  ],
  [
    "Amazon Elasticsearch Service",
    "es"
  ],
  [
    "AWS Elemental Appliances and Software",
    "elemental-appliances-software"
  ],
  [
    "AWS Elemental MediaConnect",
    "mediaconnect"
  ],
  [
    "AWS Elemental MediaConvert",
    "mediaconvert"
  ],
  [
    "AWS Elemental MediaLive",
    "medialive"
  ],
  [
    "AWS Elemental MediaPackage",
    "mediapackage"
  ],
  [
    "AWS Elemental MediaPackage VOD",
    "mediapackage-vod"
  ],
  [
    "AWS Elemental MediaStore",
    "mediastore"
  ],
  [
    "AWS Elemental MediaTailor",
    "mediatailor"
  ],
  [
    "Amazon EventBridge",
    "events"
  ],
  [
    "Amazon EventBridge Schemas",
    "schemas"
  ],
  [
    "AWS Firewall Manager",
    "fms"
  ],
  [
    "Amazon Forecast",
    "forecast"
  ],
  [
    "Amazon Fraud Detector",
    "frauddetector"
  ],
  [
    "Amazon FreeRTOS",
    "freertos"
  ],
  [
    "Amazon FSx",
    "fsx"
  ],
  [
    "Amazon GameLift",
    "gamelift"
  ],
  [
    "Amazon Glacier",
    "glacier"
  ],
  [
    "AWS Global Accelerator",
    "globalaccelerator"
  ],
  [
    "AWS Glue",
    "glue"
  ],
  [
    "AWS Ground Station",
    "groundstation"
  ],
  [
    "Amazon GroundTruth Labeling",
    "groundtruthlabeling"
  ],
  [
    "Amazon GuardDuty",
    "guardduty"
  ],
  [
    "AWS Health APIs and Notifications",
    "health"
  ],
  [
    "Amazon Honeycode",
    "honeycode"
  ],
  [
    "IAM Access Analyzer",
    "access-analyzer"
  ],
  [
    "Identity And Access Management",
    "iam"
  ],
  [
    "AWS Import Export Disk Service",
    "importexport"
  ],
  [
    "Amazon Inspector",
    "inspector"
  ],
  [
    "Amazon Interactive Video Service",
    "ivs"
  ],
  [
    "AWS IoT",
    "iot"
  ],
  [
    "AWS IoT 1-Click",
    "iot1click"
  ],
  [
    "AWS IoT Analytics",
    "iotanalytics"
  ],
  [
    "AWS IoT Device Tester",
    "iot-device-tester"
  ],
  [
    "AWS IoT Events",
    "iotevents"
  ],
  [
    "AWS IoT Greengrass",
    "greengrass"
  ],
  [
    "AWS IoT SiteWise",
    "iotsitewise"
  ],
  [
    "AWS IoT Things Graph",
    "iotthingsgraph"
  ],
  [
    "AWS IQ",
    "iq"
  ],
  [
    "AWS IQ Permissions",
    "iq-permission"
  ],
  [
    "Amazon Kendra",
    "kendra"
  ],
  [
    "AWS Key Management Service",
    "kms"
  ],
  [
    "Amazon Keyspaces (for Apache Cassandra)",
    "cassandra"
  ],
  [
    "Amazon Kinesis",
    "kinesis"
  ],
  [
    "Amazon Kinesis Analytics",
    "kinesisanalytics"
  ],
  [
    "Amazon Kinesis Analytics V2",
    "kinesisanalytics"
  ],
  [
    "Amazon Kinesis Firehose",
    "firehose"
  ],
  [
    "Amazon Kinesis Video Streams",
    "kinesisvideo"
  ],
  [
    "AWS Lake Formation",
    "lakeformation"
  ],
  [
    "AWS Lambda",
    "lambda"
  ],
  [
    "Launch Wizard",
    "launchwizard"
  ],
  [
    "Amazon Lex",
    "lex"
  ],
  [
    "AWS License Manager",
    "license-manager"
  ],
  [
    "Amazon Lightsail",
    "lightsail"
  ],
  [
    "Amazon Machine Learning",
    "machinelearning"
  ],
  [
    "Amazon Macie",
    "macie2"
  ],
  [
    "Amazon Macie Classic",
    "macie"
  ],
  [
    "Manage Amazon API Gateway",
    "apigateway"
  ],
  [
    "Amazon Managed Blockchain",
    "managedblockchain"
  ],
  [
    "Amazon Managed Streaming for Apache Kafka",
    "kafka"
  ],
  [
    "AWS Marketplace",
    "aws-marketplace"
  ],
  [
    "AWS Marketplace Catalog",
    "aws-marketplace"
  ],
  [
    "AWS Marketplace Entitlement Service",
    "aws-marketplace"
  ],
  [
    "AWS Marketplace Image Building Service",
    "aws-marketplace"
  ],
  [
    "AWS Marketplace Management Portal",
    "aws-marketplace-management"
  ],
  [
    "AWS Marketplace Metering Service",
    "aws-marketplace"
  ],
  [
    "AWS Marketplace Procurement Systems Integration",
    "aws-marketplace"
  ],
  [
    "Amazon Mechanical Turk",
    "mechanicalturk"
  ],
  [
    "Amazon Message Delivery Service",
    "ec2messages"
  ],
  [
    "AWS Migration Hub",
    "mgh"
  ],
  [
    "Amazon Mobile Analytics",
    "mobileanalytics"
  ],
  [
    "AWS Mobile Hub",
    "mobilehub"
  ],
  [
    "Amazon MQ",
    "mq"
  ],
  [
    "Amazon Neptune",
    "neptune-db"
  ],
  [
    "Network Manager",
    "networkmanager"
  ],
  [
    "AWS OpsWorks",
    "opsworks"
  ],
  [
    "AWS OpsWorks Configuration Management",
    "opsworks-cm"
  ],
  [
    "AWS Organizations",
    "organizations"
  ],
  [
    "AWS Outposts",
    "outposts"
  ],
  [
    "AWS Performance Insights",
    "pi"
  ],
  [
    "Amazon Personalize",
    "personalize"
  ],
  [
    "Amazon Pinpoint",
    "mobiletargeting"
  ],
  [
    "Amazon Pinpoint Email Service",
    "ses"
  ],
  [
    "Amazon Pinpoint SMS and Voice Service",
    "sms-voice"
  ],
  [
    "Amazon Polly",
    "polly"
  ],
  [
    "AWS Price List",
    "pricing"
  ],
  [
    "AWS Private Marketplace",
    "aws-marketplace"
  ],
  [
    "AWS Purchase Orders Console",
    "purchase-orders"
  ],
  [
    "Amazon QLDB",
    "qldb"
  ],
  [
    "Amazon QuickSight",
    "quicksight"
  ],
  [
    "Amazon RDS",
    "rds"
  ],
  [
    "Amazon RDS Data API",
    "rds-data"
  ],
  [
    "Amazon RDS IAM Authentication",
    "rds-db"
  ],
  [
    "Amazon Redshift",
    "redshift"
  ],
  [
    "Amazon Rekognition",
    "rekognition"
  ],
  [
    "AWS Resource Access Manager",
    "ram"
  ],
  [
    "Amazon Resource Group Tagging API",
    "tag"
  ],
  [
    "AWS Resource Groups",
    "resource-groups"
  ],
  [
    "AWS RoboMaker",
    "robomaker"
  ],
  [
    "Amazon Route 53",
    "route53"
  ],
  [
    "Amazon Route 53 Resolver",
    "route53resolver"
  ],
  [
    "Amazon Route53 Domains",
    "route53domains"
  ],
  [
    "Amazon S3",
    "s3"
  ],
  [
    "Amazon SageMaker",
    "sagemaker"
  ],
  [
    "AWS Savings Plans",
    "savingsplans"
  ],
  [
    "AWS Secrets Manager",
    "secretsmanager"
  ],
  [
    "AWS Security Hub",
    "securityhub"
  ],
  [
    "AWS Security Token Service",
    "sts"
  ],
  [
    "AWS Server Migration Service",
    "sms"
  ],
  [
    "AWS Serverless Application Repository",
    "serverlessrepo"
  ],
  [
    "AWS Service Catalog",
    "servicecatalog"
  ],
  [
    "Service Quotas",
    "servicequotas"
  ],
  [
    "Amazon SES",
    "ses"
  ],
  [
    "Amazon Session Manager Message Gateway Service",
    "ssmmessages"
  ],
  [
    "AWS Shield",
    "shield"
  ],
  [
    "Amazon Simple Workflow Service",
    "swf"
  ],
  [
    "Amazon SimpleDB",
    "sdb"
  ],
  [
    "AWS Snowball",
    "snowball"
  ],
  [
    "Amazon SNS",
    "sns"
  ],
  [
    "Amazon SQS",
    "sqs"
  ],
  [
    "AWS SSO",
    "sso"
  ],
  [
    "AWS SSO Directory",
    "sso-directory"
  ],
  [
    "AWS Step Functions",
    "states"
  ],
  [
    "Amazon Storage Gateway",
    "storagegateway"
  ],
  [
    "Amazon Sumerian",
    "sumerian"
  ],
  [
    "AWS Support",
    "support"
  ],
  [
    "AWS Systems Manager",
    "ssm"
  ],
  [
    "AWS Tag Editor",
    "resource-explorer"
  ],
  [
    "Amazon Textract",
    "textract"
  ],
  [
    "Amazon Transcribe",
    "transcribe"
  ],
  [
    "AWS Transfer for SFTP",
    "transfer"
  ],
  [
    "Amazon Translate",
    "translate"
  ],
  [
    "AWS Trusted Advisor",
    "trustedadvisor"
  ],
  [
    "AWS WAF",
    "waf"
  ],
  [
    "AWS WAF Regional",
    "waf-regional"
  ],
  [
    "AWS WAF V2",
    "wafv2"
  ],
  [
    "AWS Well-Architected Tool",
    "wellarchitected"
  ],
  [
    "Amazon WorkDocs",
    "workdocs"
  ],
  [
    "Amazon WorkLink",
    "worklink"
  ],
  [
    "Amazon WorkMail",
    "workmail"
  ],
  [
    "Amazon WorkMail Message Flow",
    "workmailmessageflow"
  ],
  [
    "Amazon WorkSpaces",
    "workspaces"
  ],
  [
    "Amazon WorkSpaces Application Manager",
    "wam"
  ],
  [
    "AWS X-Ray",
    "xray"
  ]
]

How to update ECS Capacity Provider

The issue

I wanted to use autoscaling for the underlying EC2 instances of an ECS Cluster. In december 2019 AWS announced the availability of the ECS capacity provider (https://aws.amazon.com/about-aws/whats-new/2019/12/amazon-ecs-capacity-providers-now-available/)

The ECS capacity provider makes it easier to set up autoscaling of the underlying EC2 instances as ECS natively only supports scaling of the ECS tasks (!= ECS/EC2 instances)

I created an ECS capacity provider via the ECS web console as you can see in the following screenshot:

ECS capacity provider shown in the ECS web console

As you can see there are only buttons for creating or deactivating capacity providers which means you can’t update an already existing capacity provider.

As I wanted to avoid creating another ECS capacity provider (I don’t like redundancy 😉 ) I was looking for a way to update ECS capacity provider. In my case I wanted to change the threshold when autoscaling should happen. The corresponding value is “Target capacity”.

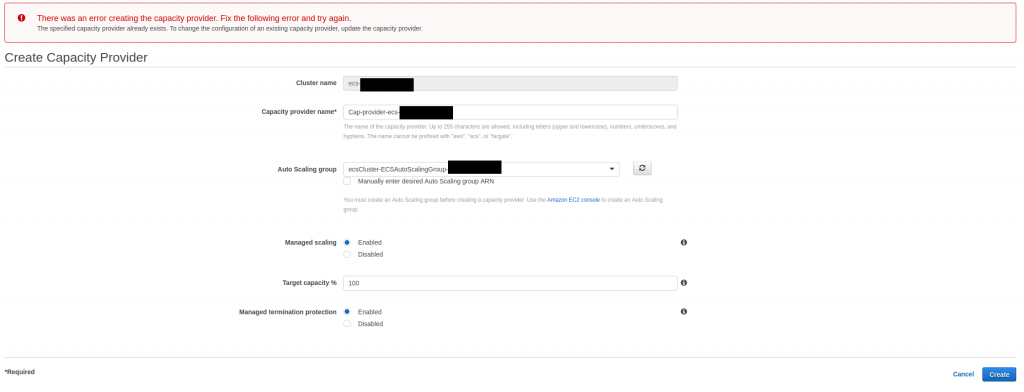
My first attempt was: just click on the create-Button and try to create a capacity provider with the same name and hope this overwrites the current one. Unfortunately this didn’t work as you can see in the following screenshot containing the error message “There was an error creating the capacity provider. Fix the following error and try again. The specified capacity provider already exists. To change the configuration of an existing capacity provider, update the capacity provider“:

To change the configuration of an existing capacity provider, update the capacity provider.”

Ok, so I asked google how to update ECS capacity provider.

I found several github issues. One of them is contained in the official containers-roadmap git repository from AWS. The issue can be found at: https://github.com/aws/containers-roadmap/issues/688 which points to https://github.com/aws/containers-roadmap/issues/633

AWS is already working on implementing the API command for updating an ECS capacity provider. Currently the second issue mentioned above is in the state “Coming soon”.

As I needed a solution now I investigated how the ECS capacity provider works behind the scenes and finally found a solution which I present you below:

The solution

As far as I know the ECS capacity provider creates an EC2 Autoscaling tracking policy which you can see when looking at the associated EC2 autoscaling group of your already existing ECS capacity provider. I marked the target capacity threshold red in the following screenshot. As I only created a screenshot after updating the policy I had to place the old value 75 manually in the image:

Target tracking policy of the EC2 autoscaling group associated with the ECS capacity provier

So my next step was to switch to CloudWatch console and change the tracking policy. Unfortunately this is not possible (at least via the console). This is the error message you get when trying to change a tracking policy:

Error message “Cannot edit TargetTracking … as it is an Auto Scaling alarm with target tracking scaling policies.

Fortunately updating an target tracking policy via API call is possible. So let’s come to the solution.

The solution

The API command aws autoscaling put-scaling-policy (https://awscli.amazonaws.com/v2/documentation/api/latest/reference/autoscaling/put-scaling-policy.html) is made for creating or updating an autoscaling policy.

You need three parameters in this case to update the tracking policy:

  • –auto-scaling-group-name: use the name of the already exisiting EC2 autoscaling group
  • –policy-name: use the name of the target tracking policy you want to change
  • –policy-type: use the type TargetTrackingScaling
  • –target-tracking-configuration: specify a JSON file containing the changes you want to achieve

So your command should look similar to mine:

aws autoscaling  put-scaling-policy --auto-scaling-group-name ecsCluster-ECSAutoScalingGroup-12345678 --policy-name AutoScaling-ECSManagedAutoScalingPlan-12345678 --policy-type TargetTrackingScaling --target-tracking-configuration file://target.json

The tracking configuration file which I named target.json looks like:

{
    "TargetValue":100.0,
    "CustomizedMetricSpecification":{
       "MetricName":"CapacityProviderReservation",
       "Namespace":"AWS/ECS/ManagedScaling",
       "Dimensions":[
          {
             "Name":"CapacityProviderName",
             "Value":"Cap-provider-ecs-12345678"
          },
          {
              "Name":"ClusterName",
              "Value":"ecs-xEV-1234"
          }
       ],
       "Statistic":"Average",
       "Unit":"Percent"
    }
 }

You have to change the CloudWatch dimensions in the JSON file as they could be named differently than mine. The first item “TargetValue” was the attribute I changed in my case.

In the following screenshot you can see the changed value of target capacity:

I hope you liked this post and helped you using the ECS target capacity provider.

Related ressources:

How to use environment variables in a training job on AWS Sagemaker

The issue

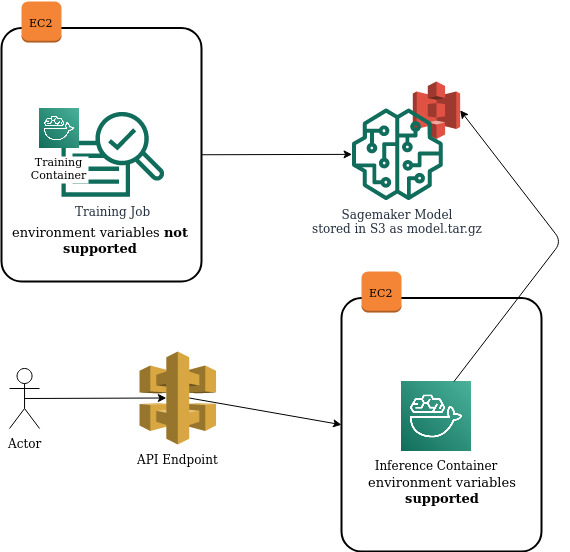
Recently I wanted to use environment variables in a Docker Container which is running a training job on AWS Sagemaker. Unfortunately using environment variables when starting the container is only possible for containers used for inference (which means the model has already been created). In the following diagram I visualized the main components of AWS Sagemaker and at which step environment variables are supported or not.

Environment variables are only supported for Docker containers running as Inference Containers

In this article I will describe how to use environment variables in a training job on AWS Sagemaker. As it’s not supported by AWS I only found a hackaround at stackoverflow (https://stackoverflow.com/questions/51215092/setup-env-variable-in-aws-sagemaker-container-bring-your-own-container). As it’s only described shortly at stackoverflow I created this article to add some comments to this solution. If you know a better way feel free to leave a comment 🙂

The solution

When you create a training job you can define hyperparameters for tuning the training. Inside the Docker Container it has to be placed at /opt/ml/input/config/hyperparameters.json

The idea of the workaround is to put the content of the environment variables to this file. An example is shown below:

{
    "batch_size": 100,
    "epochs": 10,
    "learning_rate": 0.1,
    "momentum": 0.9,
    "log_interval": 100,
    "aws_access_key_id": "ABCDEDF",
    "aws_secret_access_key": "123456"
  }

In this example I added two additional parameters called aws_access_key_id and aws_secret_access_key for passing IAM credentials to the container which for example later can be used by the AWS CLI or python script running in the container.

Now you can access the values using the tool jq:

jq -r ".aws_access_key_id" /opt/ml/input/config/hyperparameters.json
jq -r ".aws_secret_access_key" /opt/ml/input/config/hyperparameters.json

A complete example using this approach consists of these steps:

Create a bash script saved as exporting_vars.sh which exports the variables:

#!/bin/bash

export AWS_ACCESS_KEY_ID=$(jq -r ".aws_access_key_id" /opt/ml/input/config/hyperparameters.json)
export AWS_SECRET_ACCESS_KEY=$(jq -r ".aws_secret_access_key" /opt/ml/input/config/hyperparameters.json)

If the variables should be available not only inside the bash script exporting_vars.sh but also in the parent shell you have to source the script:

source exporting_vars.sh

You can do the sourcing e.g. in your main entrypoint script.

Now the variables are available the same way as passing same directly via Docker environment variables. Log in your container and try:

echo $AWS_SECRET_ACCESS_KEY
echo $AWS_ACCESS_KEY_ID

I would really appreciate it if AWS supports environment variables for training jobs out of the box. Let’s see when this will happen.

How to save google’s Lighthouse score at presigned S3 URLS and proceed/abort GitLab CI/CD Pipeline accordingly

The issue

I needed to create a job within a GitLab CI/CD Pipeline which calculates google’s Lighthouse score (https://developers.google.com/web/tools/lighthouse) for a specific website url containing the new code from this pipeline run. The calculated Lighthouse score results should be saved at a presigned AWS S3 url with a limited time to live (ttl). Only if the score is high enough the GitLab CI/CD pipeline should deploy the new code. With this additional step I wanted to avoid increased Lighthouse score on my website caused by the new deployment/release.

The solution

I’m running Lighthouse within a Docker container, so it’s easy to reuse it for other projects. As a starting point I needed chrome running in headless mode. On DockerHub I found this nice container:https://hub.docker.com/r/justinribeiro/chrome-headless/

Based on this container I added some environment variables to adjust Lighthouse and S3 configurations during runtime. This is my Dockerfile:

FROM justinribeiro/chrome-headless

# default values for environment variables
ENV URL=https://www.allaboutaws.com
ENV AWS_ACCESS_KEY_ID=EMPTY
ENV AWS_SECRET_ACCESS_KEY=EMPTY
ENV AWS_DEFAULT_REGION=EMPTY
ENV AWS_S3_LINK_TTL=EMPTY
ENV AWS_S3_BUCKET=EMPTY
ENV LIGHTHOUSE_SCORE_THRESHOLD=0.80

USER root
RUN apt-get update && \
    apt-get install -y bc curl gnupg2 sudo && \
    curl -sL https://deb.nodesource.com/setup_10.x | bash - && \
    apt-get install -y nodejs && \
    npm install -g lighthouse && \
    curl -O https://bootstrap.pypa.io/get-pip.py && \
    python get-pip.py && \
    pip install awscli && \
    apt-get purge --auto-remove -y python gnupg2 curl && \
    rm -rf /var/lib/apt/lists/*

RUN mkdir /tmp/lighthouse_score && chown chrome:chrome /tmp/lighthouse_score

ADD ./run.sh /tmp/run.sh

ENTRYPOINT /bin/bash /tmp/run.sh

The environment variables in the Dockerfile are:

  • ENV URL: the URL to run Lighthouse against
  • ENV AWS_ACCESS_KEY_ID: AWS Access Key for storing results in S3
  • ENV AWS_SECRET_ACCESS_KEY: AWS Secret Key for storing results in S3
  • ENV AWS_DEFAULT_REGION: AWS Region for S3
  • ENV AWS_S3_LINK_TTL: Time to live of presigned S3 URL
  • ENV AWS_S3_BUCKET: Name of S3 bucket containing Lighthouse result
  • ENV LIGHTHOUSE_SCORE_THRESHOLD: threshold for continuing or aborting GitLab CI/CD Pipeline regarding Lighthouse score

Run lighthouse and save results at presigned S3 URL

After installing all necessary packages the entrypoint bash script run.sh is started. The file is shown below:

#!/bin/bash

FILEPATH=/tmp/lighthouse_score
FILENAME=$(date "+%Y-%m-%d-%H-%M-%S").html
S3_PATH=s3://$AWS_S3_BUCKET/$FILENAME


echo "running lighthouse score against: " $URL
sudo -u chrome lighthouse --chrome-flags="--headless --disable-gpu --no-sandbox" --no-enable-error-reporting --output html --output-path $FILEPATH/$FILENAME $URL


if { [ ! -z "$AWS_ACCESS_KEY_ID" ] && [ "$AWS_ACCESS_KEY_ID" == "EMPTY" ]; } ||
  { [ ! -z "$AWS_SECRET_ACCESS_KEY" ] && [ "$AWS_SECRET_ACCESS_KEY" == "EMPTY" ]; } || 
  { [ ! -z "$AWS_DEFAULT_REGION" ] && [ "$AWS_DEFAULT_REGION" == "EMPTY" ]; } || 
  { [ ! -z "$S3_PATH" ] && [ "$S3_PATH" == "EMPTY" ]; } ;
then 
    printf "\nYou can find the lighthouse score result html file on your host machine in the mapped volume directory.\n" 
else
    echo "uploading lighthouse score result html file to S3 Bucket: $S3_PATH ..."
    aws s3 cp $FILEPATH/$FILENAME $S3_PATH
    if [ ! -z $AWS_S3_LINK_TTL ] && [ $AWS_S3_LINK_TTL == "EMPTY" ]; 
    then
        printf "\r\nSee the results of this run at (valid 24hrs (default) till the link expires):\n\n\r"
        aws s3 presign $S3_PATH --expires-in 86400 
        printf "\n"
    else
        printf "\n\rSee the results of this run at (valid $AWS_S3_LINK_TTL till the link expires):\n\n\r"
        aws s3 presign $S3_PATH --expires-in $AWS_S3_LINK_TTL
        printf "\n"
    fi
fi;


PERFORMANCE_SCORE=$(cat $FILEPATH/$FILENAME | grep -Po \"id\":\"performance\",\"score\":\(.*?\)} | sed 's/.*:\(.*\)}.*/\1/g')
if [ $(echo "$PERFORMANCE_SCORE > $LIGHTHOUSE_SCORE_THRESHOLD"|bc) -eq "1" ];
then
    echo "The Lighthouse Score is $PERFORMANCE_SCORE which is greater than $LIGHTHOUSE_SCORE_THRESHOLD, proceed with the CI/CD Pipeline..."
    exit 0
else
    echo "The Lighthouse Score is $PERFORMANCE_SCORE which is smaller than $LIGHTHOUSE_SCORE_THRESHOLD, DON'T proceed with the CI/CD Pipeline. Exiting now."
    exit 1
fi;

This script does the following:

  • run Lighthouse in chrome with headless mode
  • save the results as a html file in the container at /tmp/lighthouse_score using a file name containing the current date
  • if the environment variables are set, upload the html to the specified S3 bucket and presign the file using the cli command aws s3 presign
  • extract the performance score from the html file using grep and sed
  • output a message text to proceed or stop the GitLab Pipeline depending on whether $PERFORMANCE_SCORE > $LIGHTHOUSE_SCORE_THRESHOLD and return the value 0 (proceed with GitLab pipeline) or 1 (don’t proceed with GitLab pipeline)

Integrate it into Gitlab CI/CD Pipeline

The GitLab CI/CD Job in gitlab-ci.yml could look like the following YAML snippet:

calculate_lighthouse_score:
  stage: testing
  image: docker:latest
  only:
    - dev
  variables:
    URL: https://allaboutaws.com
    S3_REGION: us-east-1
    S3_LINK_TTL: 86400
    S3_BUCKET: MY-S3-BUCKET/lighthouse
    LIGHTHOUSE_SCORE_THRESHOLD: "0.50"

  script:
    - docker pull sh39sxn/lighthouse-signed
    - docker run -e URL=$URL \
      -e AWS_ACCESS_KEY_ID=$AWS_ACCESS_KEY \
      -e AWS_SECRET_ACCESS_KEY=$AWS_SECRET_KEY \
      -e AWS_DEFAULT_REGION=$S3_REGION \
      -e AWS_S3_LINK_TTL=$S3_LINK_TTL \
      -e AWS_S3_BUCKET=$S3_BUCKET \
      -e LIGHTHOUSE_SCORE_THRESHOLD=$LIGHTHOUSE_SCORE_THRESHOLD \
      sh39sxn/lighthouse-signed:latest

In GitLab logs you will see an output like:

Lighthouse Score containing presigned S3 URL in GitLab CI/CD Pipeline.

Save Lighthouse results On your machine

If you want you can run the Docker container on your machine and get the results from the container as they are stored at /tmp/lighthouse_score within the container. You have to mount a directory from your host machine to the container using docker volumes. The run statement would be:

docker run -it -v /tmp:/tmp/lighthouse_score -e URL=https://allaboutaws.com sh39sxn/lighthouse-signed-s3:latest

You find the lighthouse result on your host machine at /tmp.

External Links

I uploaded the files to my GitHub Repo at https://github.com/sh39sxn/lighthouse-signed-s3 and the prebuild Container is saved in my DockerHub Repo at https://hub.docker.com/r/sh39sxn/lighthouse-signed-s3.

How to auto-scale AWS ECS containers based on SQS queue metrics

The issue

There are a many tutorials describing how to auto-scale EC2 instances based on CPU Utilization or Memory Utilization of the host system. Similar approaches can be found to scale ECS Containers automatically based on the CPU/Memory metrics supported by default in ECS (see https://docs.aws.amazon.com/AmazonECS/latest/developerguide/cloudwatch-metrics.html). If your ECS tasks/containers process messages in a SQS queue (e.g. Laravel Queue Workers), you can still use CPU or Memory metrics as an indication for scaling in and out. In my opinion it’s much more reliable and significant if you scale in/out based on the number of messages waiting in the SQS queue to be processed. In this post I’m describing how to do Auto-scaling of ECS Containers based on SQS queue metrics.

The solution

As a starting point I used the tutorial from AWS at https://docs.aws.amazon.com/autoscaling/ec2/userguide/as-using-sqs-queue.html AWS describes how to auto-scale EC2 instances based on SQS. In my case I’m scaling ECS tasks.

define IAM User Permissions

Af first I created an IAM User to access and modify the relevant AWS resources. You can use the following IAM policy for this user. Just replace the placeholder for the AWS Region, AWS Account ID, ECS Cluster Name, ECS Service Name and your SQS Queue Name:

{
    "Version": "2012-10-17",
    "Statement": [
        {
            "Effect": "Allow",
            "Action": [
                "ecs:UpdateService",
                "ecs:DescribeServices",
                "sqs:GetQueueAttributes"
            ],
            "Resource": [
                "arn:aws:ecs:eu-central-1:123456789:service/My-ECS-Cluster/My-ECS-Service",
                "arn:aws:sqs:eu-central-1:123456789:my-sqs-queue"
            ]
        },
        {
            "Effect": "Allow",
            "Action": [
                "ecs:ListServices",
                "cloudwatch:PutMetricData",
                "ecs:ListTasks",
                "ecs:DescribeServices",
                "cloudwatch:GetMetricStatistics",
                "ecs:DescribeTasks",
                "cloudwatch:ListMetrics",
                "ecs:DescribeClusters",
                "ecs:ListClusters"
            ],
            "Resource": "*"
        }
    ]
}

Publish SQS queue Metrics to CloudWatch

At first we need to track the number of messages waiting in the SQS queue to be processed. For this I coded the following bash script:

#!/bin/bash

AWS_ACCOUNT_ID=${1:-123456789}
SQS_QUEUE_NAME=${2:-My-SQS-Queue}
ECS_CLUSTER=${3:-My-ECS-Cluster}
ECS_SERVICE=${4:-My-ECS-Service}
CW_METRIC=${5:-BacklogPerECSTask}
CW_NAMESPACE=${6:-ECS-SQS-Autoscaling}
CW_DIMENSION_NAME=${7:-SQS-Queue}
CW_DIMENSION_VALUE=${8:-My-SQS-Queue}

ApproximateNumberOfMessages=$(aws sqs get-queue-attributes --queue-url https://sqs.$AWS_DEFAULT_REGION.amazonaws.com/$AWS_ACCOUNT_ID/$SQS_QUEUE_NAME --attribute-names All | jq -r '.[] | .ApproximateNumberOfMessages')
echo "ApproximateNumberOfMessages: " $ApproximateNumberOfMessages

NUMBER_TASKS=$(aws ecs list-tasks --cluster $ECS_CLUSTER --service-name $ECS_SERVICE | jq '.taskArns | length')
echo "NUMBER_TASKS: " $NUMBER_TASKS

MyBacklogPerWorker=$((($ApproximateNumberOfMessages / $NUMBER_TASKS) + ($ApproximateNumberOfMessages % $NUMBER_TASKS > 0)))
echo "MyBacklogPerWorker: " $MyBacklogPerWorker

# send average number of current backlogs of the workers as a custom Metric to CloudWatch
aws cloudwatch put-metric-data --metric-name $CW_METRIC --namespace $CW_NAMESPACE \
  --unit None --value $MyBacklogPerWorker --dimensions $CW_DIMENSION_NAME=$CW_DIMENSION_VALUE

In the beginning some variables are defined. You can pass the variables as arguments to the bash script and define default values in case you call the script without arguments. I won’t explain each of them in detail because they should be self-explanatory. The most important points are:

You get the number of messages available for retrieval from the SQS queue via the CLI command get-queue-attributes (see https://docs.aws.amazon.com/cli/latest/reference/sqs/get-queue-attributes.html) Using the json tool jq allows us to easily extract the needed value ApproximateNumberOfMessages from the json formatted result.

The metric ApproximateNumberOfMessages can not be found in the SQS metrics. You only get this value via CLI command. Unfortunately I didn’t find any information how AWS calculates this value. In my impression it’s somehow calculated using the metrics NumberOfMessagesSent and ApproximateNumberOfMessagesVisible which are available via the AWS Management Console, CLI and API.

In the next step we calculate the current backlog of our ECS tasks (in my case called workers as I coded this for Laravel queue workers). ApproximateNumberOfMessages is divided by the current number of running ECS tasks which we get via the command ecs list-tasks. The result is saved in the variable MyBacklogPerWorker and this value is pushed to the custom Cloudwatch Metric via the CLI Command put-metric-data (see https://docs.aws.amazon.com/cli/latest/reference/cloudwatch/put-metric-data.html).

I decided to run the bash script every 1 minute via a cronjob (see later section explaining the Docker container).

Calculate Backlogs and Scale in/OUT based on CloudWatch Metrics

I’m using the size of the backlog per task/worker as a threshold for scaling in or out. I defined the variable LATENCY and PROCESSING_TIME. LATENCY is the maximum allowed number of seconds till a message from the SQS queue should be processed (queue delay). PROCESSING_TIME is the average number of seconds an ECS task needs for processing a message from the SQS queue. Deviding those two values defines the allowed backlog per ECS task/worker. In the code snippet below 10 (20/2=10) messages is the maximum of messages one ECS task should need to process.

LATENCY=${1:-20} # maximum allowed latency (seconds) for processing a message
PROCESSING_TIME=${2:-2}  # average number of seconds to process an image
backlog_per_worker_allowed=$(($LATENCY / $PROCESSING_TIME)) # number of messages a worker can process within the allowed latency timeframe

I’m running the second bash script (shown below) every 5 minutes. It will get the custom CloudWatch metric send by the first bash script for the last 20 minutes from now and calculate the average backlog for all currently running ECS tasks. If the average value of the backlog for all currently running ECS tasks is higher than the defined threshold we will scale out.

The whole bash script looks like:

#!/bin/bash

LATENCY=${1:-20} # maximum allowed latency (seconds) for processing a message
PROCESSING_TIME=${2:-2}  # average number of seconds to process an image
ECS_CLUSTER=${3:-My-ECS-Cluster}
ECS_SERVICE=${4:-My-ECS-Service}
CW_METRIC=${5:-BacklogPerECSTask}
CW_NAMESPACE=${6:-ECS-SQS-Autoscaling}
CW_DIMENSION_NAME=${7:-SQS-Queue}
CW_DIMENSION_VALUE=${8:-My-SQS-Queue}
MAX_LIMIT_NUMBER_QUEUE_WORKERS=${9:-200}

ceil() {
  if [[ "$1" =~ ^[0-9]+$ ]]
    then
        echo $1;
        return 1;
  fi                                                                      
  echo "define ceil (x) 
        {if (x<0) {return x/1} \
          else {if (scale(x)==0) {return x} \
            else {return x/1 + 1 }}} ; ceil($1)" | bc
}

backlog_per_worker_allowed=$(($LATENCY / $PROCESSING_TIME)) # number of messages a worker can process within the allowed latency timeframe
echo "backlog_per_worker_allowed: " $backlog_per_worker_allowed

# get backlogs of the worker for the last 10 minutes
export LC_TIME=en_US.utf8
CF_JSON_RESULT=$(aws cloudwatch get-metric-statistics --namespace $CW_NAMESPACE --dimensions Name=$CW_DIMENSION_NAME,Value=$CW_DIMENSION_VALUE --metric-name $CW_METRIC \
 --start-time "$(date -u --date='5 minutes ago')" --end-time "$(date -u)" \
 --period 60 --statistics Average)
echo "CF_JSON_RESULT: " $CF_JSON_RESULT

# sum up the average values of the last 10 minutes
SUM_OF_AVERAGE_CW_VALUES=$(echo $CF_JSON_RESULT | jq '.Datapoints | .[].Average' | awk '{ sum += $1 } END { print sum }')

echo "SUM_OF_AVERAGE_VALUES: " $SUM_OF_AVERAGE_CW_VALUES

# count the number of average values the CW Cli command returned (varies between 4 and 5 values)
NUMBER_OF_CW_VALUES=$(echo $CF_JSON_RESULT | jq '.Datapoints' | jq length)

echo "NUMBER_OF_CW_VALUES: " $NUMBER_OF_CW_VALUES

# calculate average number of backlog for the workers in the last 10 minutes
AVERAGE_BACKLOG_PER_WORKER=$(echo "($SUM_OF_AVERAGE_CW_VALUES / $NUMBER_OF_CW_VALUES)" | bc -l )
echo "AVERAGE_BACKLOG_PER_WORKER: " $AVERAGE_BACKLOG_PER_WORKER

# calculator factor to scale in/out, then ceil up to next integer to be sure the scaling is sufficient
FACTOR_SCALING=$(ceil $(echo "($AVERAGE_BACKLOG_PER_WORKER / $backlog_per_worker_allowed)" | bc -l) )
echo "FACTOR_SCALING: " $FACTOR_SCALING

# get current number of ECS tasks
CURRENT_NUMBER_TASKS=$(aws ecs list-tasks --cluster $ECS_CLUSTER --service-name $ECS_SERVICE | jq '.taskArns | length')
echo "CURRENT_NUMBER_TASKS: " $CURRENT_NUMBER_TASKS

# calculate new number of ECS tasks, print leading 0 (0.43453 instead of .43453)
NEW_NUMBER_TASKS=$( echo "($FACTOR_SCALING * $CURRENT_NUMBER_TASKS)" | bc -l |  awk '{printf "%f", $0}')
echo "NEW_NUMBER_TASKS: " $NEW_NUMBER_TASKS


## we run more than enough workers currently, scale in slowly by 20 %
if [ $FACTOR_SCALING -le "1" ];
then
  NEW_NUMBER_TASKS=$( echo "(0.8 * $CURRENT_NUMBER_TASKS)" | bc -l)
fi;

echo "NEW_NUMBER_TASKS: " $NEW_NUMBER_TASKS

# round number of tasks to int
NEW_NUMBER_TASKS_INT=$( echo "($NEW_NUMBER_TASKS+0.5)/1" | bc )


if [ ! -z $NEW_NUMBER_TASKS_INT ];
    then
        if [ $NEW_NUMBER_TASKS_INT == "0" ];
          then
              NEW_NUMBER_TASKS_INT=1 # run at least one worker
        fi;
        if [ $NEW_NUMBER_TASKS_INT -gt $MAX_LIMIT_NUMBER_QUEUE_WORKERS ];
          then
              NEW_NUMBER_TASKS_INT=$MAX_LIMIT_NUMBER_QUEUE_WORKERS # run not more than the maximum limit of queue workers
        fi;
fi;

echo "NEW_NUMBER_TASKS_INT:" $NEW_NUMBER_TASKS_INT

# update ECS service to the calculated number of ECS tasks
aws ecs update-service --cluster $ECS_CLUSTER --service $ECS_SERVICE --desired-count $NEW_NUMBER_TASKS_INT 1>/dev/null

There have been some issues I want to mention:

  • I needed to set the environment variable LC_TIME to en_US.utf8 in order to get the right output from the unix commands date -u and date -u –date=’10 minutes ago’ when calling the CLI command aws cloudwatch get-metric-statistics for the last 10 minutes.
  • I used the tool bc (Basic Calculator) to do math operations like division from floating point numbers
  • the bash function ceil() at the beginning of the script rounds up floating point number to the next larger integer (if the argument is already an integer, it just returns the argument)
  • FACTOR_SCALING is calculated by dividing the currently calculated average backlog per ECS task by the allowed backlog per ECS task, it’s rounded up to the next larger integer using the function ceil():
FACTOR_SCALING=$(ceil $(echo "($AVERAGE_BACKLOG_PER_WORKER / $backlog_per_worker_allowed)" | bc -l) )
  • the new number of ECS tasks is calculated by the product of the FACTOR_SCALING and the currently running number of ECS tasks CURRENT_NUMBER_TASKS:
NEW_NUMBER_TASKS=$( echo "($FACTOR_SCALING * $CURRENT_NUMBER_TASKS)" | bc -l |  awk '{printf "%f", $0}')
  • this value is rounded to an integer
echo "($NEW_NUMBER_TASKS+0.5)/1" | bc
  • There is an edge case you have to take care: when FACTOR_SCALING is 1 it means the we run enough ECS tasks at the moment, so we should scale in. Otherwise we would keep running the same amount of ECS tasks forever and would never scale in as FACTOR_SCALING is always at least 1 (see above point, FACTOR_SCALING is rounded up to the next higher integer which means >= 1). In this case I defined to scale in by 20%:
## we run more than enough workers currently, scale in slowly by 20 %
if [ $FACTOR_SCALING -le "1" ];
then
  NEW_NUMBER_TASKS=$( echo "(0.8 * $CURRENT_NUMBER_TASKS)" | bc -l)
fi;
  • I added a variable MAX_LIMIT_NUMBER_QUEUE_WORKERS which is used as the maximum number of queue workers running at the same time. I’m using this as a security measure in case my script fails somehow and wants to start way to many workers (which could be expensive).
        if [ $NEW_NUMBER_TASKS_INT -gt $MAX_LIMIT_NUMBER_QUEUE_WORKERS ];
          then
              NEW_NUMBER_TASKS_INT=$MAX_LIMIT_NUMBER_QUEUE_WORKERS # run not more than the maximum limit of queue workers
        fi;
  • after all these calculations we call the AWS CLI command aws ecs update-service to update the ECS service to the new number of ECS tasks, only errors are printed to stdout to avoid the huge default output from this CLI command:
# update ECS service to the calculated number of ECS tasks
aws ecs update-service --cluster $ECS_CLUSTER --service $ECS_SERVICE --desired-count $NEW_NUMBER_TASKS_INT 1>/dev/null

Run the bash Scripts via Cron in a Docker Container

To run the first bash script called publish-Backlog-per-Worker.sh every 1 minute and the second bash script called scaling.sh every 10 minutes I created a Docker container for it (which itself is running as an ECS task). The Dockerfile looks like:

FROM alpine:latest

LABEL maintainer="https://allaboutaws.com"
ARG DEBIAN_FRONTEND=noninteractive

USER root

RUN apk add --update --no-cache \
    jq \
    py-pip \
    bc \
    coreutils \
    bash

# update pip
RUN pip install --upgrade pip

RUN pip install awscli --upgrade

# Configure cron
COPY ./docker/workers/scaling/crontab /etc/cron/crontab

# Init cron
RUN crontab /etc/cron/crontab

WORKDIR /code/
COPY ./docker/workers/scaling/scaling.sh /code/
COPY ./docker/workers/scaling/publish-Backlog-per-Worker.sh /code

COPY ./docker/workers/scaling/entrypoint.sh /etc/app/entrypoint
RUN chmod +x /etc/app/entrypoint
ENTRYPOINT /bin/sh /etc/app/entrypoint

EXPOSE 8080

It’s an alpine container in which the necessary tools jq, bc, coreutils (for command date), bash and aws cli are installed.

The entrypoint file starts the cron daemon:

#!/bin/sh
set -e

crond -f

The file crontab which is copied inside the container (Don’t forget to put a new line at the end of this file! Cronjob needs it!):

*/10 * * * * /bin/bash /code/scaling.sh $LATENCY $PROCESSING_TIME $ECS_CLUSTER $ECS_SERVICE $CW_METRIC $CW_NAMESPACE $CW_DIMENSION_NAME $CW_DIMENSION_VALUE $MAX_LIMIT_NUMBER_QUEUE_WORKERS
* * * * * /bin/bash /code/publish-Backlog-per-Worker.sh $AWS_ACCOUNT_ID $SQS_QUEUE_NAME $ECS_CLUSTER $ECS_SERVICE $CW_METRIC $CW_NAMESPACE $CW_DIMENSION_NAME $CW_DIMENSION_VALUE

As you can see the arguments for the bash scripts are environment variables. I set them when starting the container.

How to build the Docker container

docker build -t ecs-autoscaling-sqs-metrics:latest -f ./Cronjob.Dockerfile .

How to run the Docker Container

docker run -it -e AWS_DEFAULT_REGION=eu-central-1 -e AWS_ACCESS_KEY_ID=XXX -e AWS_SECRET_ACCESS_KEY=XXX -e AWS_ACCOUNT_ID=XXX -e LATENCY=20 -e PROCESSING_TIME=2 -e SQS_QUEUE_NAME=My-SQS-Queue -e ECS_CLUSTER=My-ECS-Cluster -e ECS_SERVICE=My-ECS-Service -e CW_METRIC=MyBacklogPerTask -e CW_NAMESPACE=ECS-SQS-Scaling -e CW_DIMENSION_NAME=SQS-Queue -e CW_DIMENSION_VALUE=My-SQS-Queue -e MAX_LIMIT_NUMBER_QUEUE_WORKERS=200 ecs-autoscaling-sqs-metrics:latest

If you want to run this Docker Container as an ECS task, too, you can use this task definition using the prebuild docker image from DockerHub:

{
    "family": "queue-worker-autoscaling",
    "networkMode": "bridge",
    "taskRoleArn": "arn:aws:iam::123456789:role/ecsTaskRole",
    "containerDefinitions": [
        {
            "name": "cronjob",
            "image": "sh39sxn/ecs-autoscaling-sqs-metrics:latest",
            "memoryReservation": 256,
            "cpu": 512,
            "essential": true,
            "portMappings": [{
                "hostPort": 0,
                "containerPort": 8080,
                "protocol": "tcp"
            }],
            "environment": [{
                "name": "AWS_DEFAULT_REGION",
                "value": "eu-central-1"
            },{
                "name": "AWS_ACCESS_KEY_ID",
                "value": "XXX"
            },{
                "name": "AWS_SECRET_ACCESS_KEY",
                "value": "XXX"
            },{
                "name": "AWS_ACCOUNT_ID",
                "value": "123456789"
            },{
                "name": "SQS_QUEUE_NAME",
                "value": "My-SQS-Queue"
            },{
                "name": "LATENCY",
                "value": "20"
            },{
                "name": "PROCESSING_TIME",
                "value": "2"
            },{
                "name": "ECS_CLUSTER",
                "value": "MY-ECS-CLUSTER"
            },{
                "name": "ECS_SERVICE",
                "value": "My-QUEUE-WORKER-SERVICE"
            },{
                "name": "CW_METRIC",
                "value": "BacklogPerECSTask"
            },{
                "name": "CW_NAMESPACE",
                "value": "ECS-SQS-Autoscaling"
            },{
                "name": "CW_DIMENSION_NAME",
                "value": "SQS-Queue"
            },{
                "name": "CW_DIMENSION_VALUE",
                "value": "My-SQS-Queue"
            },{
                "name": "MAX_LIMIT_NUMBER_QUEUE_WORKERS",
                "value": "200"
            }],
            "logConfiguration": {
                "logDriver": "awslogs",
                "options": {
                  "awslogs-group": "/ecs/Queue-Worker-Autoscaling",
                  "awslogs-region": "eu-central-1",
                  "awslogs-stream-prefix": "ecs"
                }
              }
        }
    ]
}

I added a logging configuration for CloudWatch Logs. This makes it easier to track and debug the algorithm. Don’t forget to create the CloudWatch log group /ecs/Queue-Worker-Autoscaling before starting the ECS task. Otherwise it will fail because the log group has to exist before you start the ECS task which pushes log to it.

Results

Using an example timeframe I show you how the auto-scaling of ECS containers based on SQS metrics works at the end.

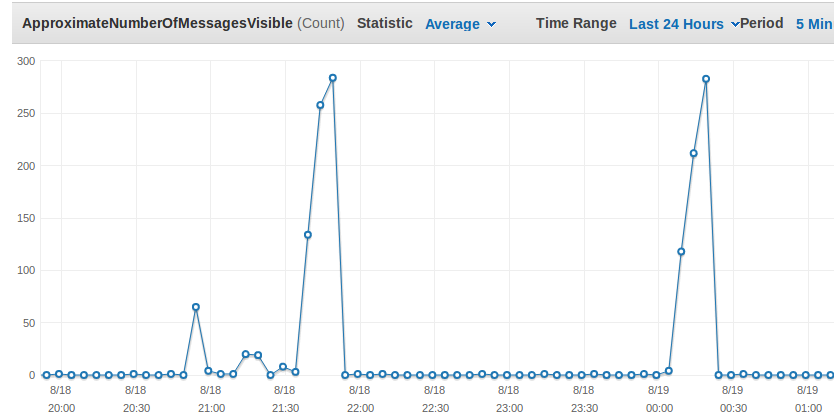
The following screenshot shows the metric ApproximateNumberOfMessagesVisible which is significant for the current workload.

Above you can see two peaks at around 23:50 and 2:20. The custom metric showing the current Backlog per ECS Task fits to it as you see here:

The CloudWatch Logs from the Cronjob ECS Tasks shows that the algorithm recognized that the average backlog per worker is too high and the number of workers is increased from 2 to 24.

Custom Metric BacklogPerECSTask

10 minutes later the script checks again the average backlog per ECS Task and again scales in as the it’s still too high:

Custom Metric BacklogPerECSTask

Here you can see a graphical representation of the number of ECS Tasks:

Number of ECS Tasks

You can see how the number of ECS Tasks increased and then descreased in steps by 20% as defined in the bash script.

External Links

I uploaded the files to my GitHub Repo at https://github.com/sh39sxn/ecs-autoscaling-sqs-metrics and the prebuild Container is saved in my DockerHub Repo at https://hub.docker.com/r/sh39sxn/ecs-autoscaling-sqs-metrics.

How to mine Aion Coins using Docker

The issue

I wanted to mine Aion coins when AION released their blockchain called mainnet at April 25th, 2018 (https://blog.aion.network/aion-mainnet-launch-kilimanjaro-22a2f4ff8087). I recognized that the installation process of setting up the solo miner, the solo mining pool and the GPU miner software is very difficult and time consuming. So I started to develop Docker containers for each of these 3 components. It was a difficult job, especially using GPUs within a Docker container. In this post I give a summary about it.

The solution

You can find the project at https://github.com/sh39sxn/mining-aion-coins I won’t explain how to use the containers here as you can find the installation guide on the github repo itself. There are already prebuild containers ready to download at my Docker Hub repos at https://hub.docker.com/u/sh39sxn/.

In this post I want to go into detail regarding using Docker and GPUs. As you mainly use NVidia GPUs for mining I used the prebuild Docker container described at https://github.com/NVIDIA/nvidia-docker

As a prerequisite you need the CUDA drivers installed on your host machine. For installation instructions see https://docs.nvidia.com/cuda/cuda-installation-guide-linux/index.html#package-manager-installation
The commands to install CUDA drivers 9.1 on Ubuntu 16.04 are as follows:

wget http://developer.download.nvidia.com/compute/cuda/repos/ubuntu1604/x86_64/cuda-repo-ubuntu1604_9.1.85-1_amd64.deb
sudo dpkg -i cuda-repo-ubuntu1604_9.1.85-1_amd64.deb
sudo apt-key adv --fetch-keys http://developer.download.nvidia.com/compute/cuda/repos/ubuntu1604/x86_64/7fa2af80.pub
sudo apt-get update
sudo apt-get install cuda
export PATH=/usr/local/cuda-9.1/bin${PATH:+:${PATH}}
export LD_LIBRARY_PATH=/usr/local/cuda-9.1/lib64                         ${LD_LIBRARY_PATH:+:${LD_LIBRARY_PATH}}

To check whether the drivers are installed correctly:

echo $LD_LIBRARY_PATH
nvcc --version

You should see an output showing

If you want to install newer CUDA drivers e.g. version 10.1 visit https://developer.nvidia.com/cuda-downloads?target_os=Linux&target_arch=x86_64&target_distro=Ubuntu&target_version=1604&target_type=deblocal and check the appropiate deb download url from there. Then replace it in the above shell command.

Now you can install nvidia-docker and test it running a container temporarily (–rm flag deletes container after stopping it):

# If you have nvidia-docker 1.0 installed: we need to remove it and all existing GPU containers
docker volume ls -q -f driver=nvidia-docker | xargs -r -I{} -n1 docker ps -q -a -f volume={} | xargs -r docker rm -f
sudo apt-get purge -y nvidia-docker

# Add the package repositories
curl -s -L https://nvidia.github.io/nvidia-docker/gpgkey | \
  sudo apt-key add -
distribution=$(. /etc/os-release;echo $ID$VERSION_ID)
curl -s -L https://nvidia.github.io/nvidia-docker/$distribution/nvidia-docker.list | \
  sudo tee /etc/apt/sources.list.d/nvidia-docker.list
sudo apt-get update

# Install nvidia-docker2 and reload the Docker daemon configuration
sudo apt-get install -y nvidia-docker2
sudo pkill -SIGHUP dockerd

# Test nvidia-smi with the latest official CUDA image
docker run --runtime=nvidia --rm nvidia/cuda:9.0-base nvidia-smi

As I’m using docker-compose for easier use of the three containers (mining pool, kernel, GPU/CPU miner) you have to see Docker to use nvidia as the default runtime on your host machine. Open or create the appropiate config file at /etc/docker/daemon.json and add this line:

"default-runtime": "nvidia"

Your whole config file probably looks like this:

{
    "default-runtime": "nvidia",
    "runtimes": {
        "nvidia": {
            "path": "/usr/bin/nvidia-container-runtime",
            "runtimeArgs": []
        }
    }
}

Now you are ready to use docker-compose with nvidia-docker.

How to clean up custom AMIs in order to use them with AWS Elastic Beanstalk

The issue

This time I needed to make some modifications for an application managed by AWS Elastic Beanstalk. I had to modify something on the host system which means I had to create a new AMI which will then be used by Elastic Beanstalk. At first I didn’t take care of cleaning up the EC2 instance before creating the AMI. This means new launched instances already contained some application code and most of all some old Elastic Beanstalk configurations. Unfortunately not all configurations were overriden during the (first initial) deployment. In my case the name of the attached SQS queue wasn’t updated (regarding SQS queue configurations and my observations see the end of this post about additional comments).

The solution

You have to delete some certain directories before creating the AMI. I couldn’t find any official tutorials from AWS or stackoverflow posts about which directories I have to delete. That’s why I want to summarize it here. It’s difficult to give a general instruction as Elastic Beanstalk supports a huge amount of different setups (Web server environment vs. Worker environment, Docker vs. Multi-container Docker, Go vs. .NET vs. Java vs …). You can use the following commands as a starting point. If you want to add something feel free to leave a comment!

So let’s start:

Delete the directory containing the application code:

rm -rf /opt/elasticbeanstalk/

Depending which platform (Go, Java, Python,…) you are using you should delete the directory containing executables, too. In my case it was Python which is also installed at /opt by Elastic Beanstalk:

rm -rf /opt/python/

Elastic Beanstalk uses different software as proxy servers for processing http requests. For python it’s Apache. Visit https://docs.aws.amazon.com/elasticbeanstalk/latest/platforms/platforms-supported.html#platforms-supported.python to see which platforms use Apache, nginx or IIS in the preconfigured AMIs.

So keep in mind the directories containing configuration files for apache, nginx or IIS. For apache you find them at:

/etc/httpd/

The most important files are probably:

  • /etc/httpd/conf/httpd.conf
  • /etc/httpd/conf.d/wsgi.conf
  • /etc/httpd/conf.d/wsgi_custom.conf (if you modified the wsgi settings)


Optional:

Delete logfiles created and filled up by Elastic Beanstalk (to avoid seeing old log entries in the Elastic Beanstalk GUI during the first initial deployment):

rm /var/log/eb-activity.log /var/log/eb-cfn-init-call.log /var/log/eb-cfn-init.log /var/log/eb-commandprocessor.log /var/log/eb-publish-logs.log /var/log/eb-tools.log

If you are using Elastic Beanstalk as an worker environment and you have attached a SQS queue you can delete the corresponding log directory, too:

rm -rf /var/log/aws-sqsd/

Additional comments

I was really surprised that I didn’t found anything about the configuration file for the sqs queue. The only more detailed information about Elastic Beanstalk and SQS queues I found was https://docs.aws.amazon.com/elasticbeanstalk/latest/dg/using-features-managing-env-tiers.html which wasn’t very helpful for me but still interesting to read (especially regarding the HTTP headers for processing SQS messages).

The configuration is saved at /etc/aws-sqsd.d/default.yaml and has the following format:

---
http_connections: 10
http_port: 80
verbose: false
inactivity_timeout: 9
healthcheck: TCP:80
environment_name: My-ElasticBeanstalk-Environment-Example
queue_url: https://sqs.us-east-1.amazonaws.com/123456789/my-sqs-queue
dynamodb_ssl: true
quiet: false
via_sns: false
retention_period: 60
sqs_ssl: true
threads: 50
mime_type: application/json
error_visibility_timeout: 2
debug: false
http_path: /
sqs_verify_checksums: true
connect_timeout: 2
visibility_timeout: 10
keepalive: true

During the first initial deployment this file was not updated. Deleting this file and creating an AMI didn’t help, too. I assume that this file is generated by files from /opt/elasticbeanstalk. Using grep to find out from which configurations files the default.yaml is being generated didn’t yield anything. Doing a deployment later manual/automatically the file was updated with the correct SQS queue name. I assume this applies to the other settings, too.

If you know how this yaml is generated please leave a comment. I would be very interested to know the details.

Self-healing of AWS Elastic Beanstalk EC2 instances

The issue

This time I observed the problem that an application managed by AWS Elastic Beanstalk was often failing. The app often failed because of some memory errors and I needed to find a quick solution in the first step. Replacing the underlying EC2 instance was the way I wanted to go for now.

The solution

So my first thought was creating an ALB/ELB just for doing health checks. This would work when the autoscaling group is configured to use ELB/ALB as health check type (see https://docs.aws.amazon.com/autoscaling/ec2/userguide/healthcheck.html). The disadvantage of this solution is that you have to pay for the load balancer although you don’t need it actually.

At the end I decided to write a shell script running on each instance so the instance is taking care of itself. The script is checking a logfile. If there are (two many) errors it will execute an aws autoscaling cli command to terminate the instance without decreasing the desired capacity. As a consequence the autoscaling group will launch a new instance.

You should know that AWS Elastic Beanstalk supports several logfiles per default. On the page https://docs.aws.amazon.com/elasticbeanstalk/latest/dg/health-enhanced-serverlogs.html the different logfiles and its paths are described. I decided to use the application logs at /var/log/nginx/healthd/.

The log entries contains different values like the time of the request, the path of the request and so on. For me the http status code of the result was important. It’s the second column, the delimiter is “. Here is an example:

1437609879.311"/"200"0.083"0.083"177.72.242.17

In this case the http status code is 200.

awk tool for parsing log lines

I used the awk tool to get the second column of the logfile entries which contains http status code 500 and counted them:

awk 'BEGIN { FS="\"" ; count=0 } $3=="500" { ++count ; } END { print count ; } '

As there can be several application logs at /var/log/nginx/healthd/ I wanted to only consider the newest logfile. So I used this small code to get the newest logfile:

ls -t1 ./ |  head -n 1

As the mentioned app fails regularly I wanted to only replace the instance when a certain threshold of 500 status codes was exceeded. I saved the number of 500s in a variable, defined the percentage of allowed 500s and defined the number of logfile entries/lines I want to respect. As I needed to do float calculations in order to calculate the percentage I used the tool “bc”.

The aws autoscaling group cli supports the method terminate-instance-in-auto-scaling-group (see https://docs.aws.amazon.com/cli/latest/reference/autoscaling/terminate-instance-in-auto-scaling-group.html). It’s important to use the flag –no-should-decrement-desired-capacity in order to replace the failed instance and to not decrease the capacity.

Here is the final script now.

The final shell script

#!/bin/bash

# get the instance id
INSTANCE_ID=`curl -s http://169.254.169.254/latest/meta-data/instance-id`
# number of logfile lines to be regarded, default value: 30
NUMBER_LOGFILE=${1:-30}
# percentage of allowed failed requests, default value: 0.60
PERCENTAGE_OK=${2:-0.60}


cd /var/log/httpd/healthd/
# number of 500s in the newest logfile
COUNTER=`tail -n $NUMBER_LOGFILE $(ls -t1 ./ |  head -n 1) | awk 'BEGIN { FS="\"" ; count=0 } $3=="500" { ++count ; } END { print count ; } '`
# calculate percentage of 500s
RESULT=$(echo "$COUNTER / $NUMBER_LOGFILE" | bc -l)


# if there are more failed requests then allowed in variable $PERCENTAGE_OK --> terminate this instance and replace it with a new one
if [ $(echo "$RESULT > $PERCENTAGE_OK" | bc) = 1 ] 
then
    echo "$(date) too many failed requests $(echo "scale=2; ($RESULT*100)/1" | bc -l)%, terminating instance...\n" && \
    aws autoscaling terminate-instance-in-auto-scaling-group --instance-id $INSTANCE_ID --no-should-decrement-desired-capacity
else
    echo "$(date) instance is healthy...only $(echo "scale=2; ($RESULT*100)/1" | bc -l)% requests failed.\n"
fi

I created a cronjob which runs the script every minute. The script supports two parameters. The first one defines the number of logfile lines to consider for the health check. The second parameter defines the accepted percentage threshold of failed requests. The cronjob could look like:

* * * * * root /bin/bash /root/healthcheck.sh 30 0.6 >> /var/log/healthcheck-cron.log  2>&1

Don’t forget to add a newline ad the end of the cronjob file! Otherwise the cronjob is not executed. See https://manpages.debian.org/stretch/cron/crontab.5.en.html

[Errno 14] HTTP Error 403 – Forbidden – Pulling from AWS packages repo not possible

My very first post in this blog is about an issue I had using AWS Elastic Beanstalk for running an application which needs GPUs.

The issue

One day the app suddenly didn’t worked anymore on some EC2 instances. Going to the Elastic Beanstalk Environment Overview page showed already the broken environment in red color. I logged in to one of the broken EC2 instances and checked some Elastic Beanstalk logs. The logfile at /var/log/eb-activity.log shed light on the issue. One of the platform hooks failed when the instance was bootstrapping. Below you can see the relevant extract of the logfile:

[2019-01-10T09:27:48.730Z] INFO  [3495]  - [Initialization/PreInitStage0/PreInitHook/02installpackages.sh] : Starting activity...
[2019-01-10T09:27:51.620Z] INFO  [3495]  - [Initialization/PreInitStage0/PreInitHook/02installpackages.sh] : Activity execution failed, because: ++ /opt/elasticbeanstalk/bin/get-config container -k python_version
  + PYTHON_VERSION=2.7
  + is_baked python_packages
  + [[ -f /etc/elasticbeanstalk/baking_manifest/python_packages ]]
  + false
  + yum install -y httpd24 gcc44 mysql-5.5 mysql-devel
  Loaded plugins: dkms-build-requires, priorities, update-motd, upgrade-helper
  http://packages.us-west-1.amazonaws.com/2016.09/graphics/efb479739386/x86_64/repodata/repomd.xml: [Errno 14] HTTP Error 403 - Forbidden
  Trying other mirror.
  To address this issue please refer to the below knowledge base article
  
  https://access.redhat.com/solutions/69319
  
  If above article doesn't help to resolve this issue please open a ticket with Red Hat Support.
  
  http://packages.us-east-1.amazonaws.com/2016.09/graphics/efb479739386/x86_64/repodata/repomd.xml: [Errno 14] HTTP Error 403 - Forbidden
  Trying other mirror.
  http://packages.us-west-2.amazonaws.com/2016.09/graphics/efb479739386/x86_64/repodata/repomd.xml: [Errno 14] HTTP Error 403 - Forbidden
  Trying other mirror.
  http://packages.eu-west-1.amazonaws.com/2016.09/graphics/efb479739386/x86_64/repodata/repomd.xml: [Errno 14] HTTP Error 403 - Forbidden
  Trying other mirror.
  http://packages.eu-central-1.amazonaws.com/2016.09/graphics/efb479739386/x86_64/repodata/repomd.xml: [Errno 14] HTTP Error 403 - Forbidden
  Trying other mirror.
  http://packages.ap-southeast-1.amazonaws.com/2016.09/graphics/efb479739386/x86_64/repodata/repomd.xml: [Errno 14] HTTP Error 403 - Forbidden
  Trying other mirror.
  http://packages.ap-northeast-1.amazonaws.com/2016.09/graphics/efb479739386/x86_64/repodata/repomd.xml: [Errno 14] HTTP Error 403 - Forbidden
  Trying other mirror.
  http://packages.ap-northeast-2.amazonaws.com/2016.09/graphics/efb479739386/x86_64/repodata/repomd.xml: [Errno 14] HTTP Error 403 - Forbidden
  Trying other mirror.
  http://packages.sa-east-1.amazonaws.com/2016.09/graphics/efb479739386/x86_64/repodata/repomd.xml: [Errno 14] HTTP Error 403 - Forbidden
  Trying other mirror.
  http://packages.ap-southeast-2.amazonaws.com/2016.09/graphics/efb479739386/x86_64/repodata/repomd.xml: [Errno 14] HTTP Error 403 - Forbidden
  Trying other mirror.
  
  
   One of the configured repositories failed (amzn-graphics-Base),
   and yum doesn't have enough cached data to continue. At this point the only
   safe thing yum can do is fail. There are a few ways to work "fix" this:
  
       1. Contact the upstream for the repository and get them to fix the problem.
  
       2. Reconfigure the baseurl/etc. for the repository, to point to a working
          upstream. This is most often useful if you are using a newer
          distribution release than is supported by the repository (and the
          packages for the previous distribution release still work).
  
       3. Disable the repository, so yum won't use it by default. Yum will then
          just ignore the repository until you permanently enable it again or use
          --enablerepo for temporary usage:
  
              yum-config-manager --disable amzn-graphics
  
       4. Configure the failing repository to be skipped, if it is unavailable.
          Note that yum will try to contact the repo. when it runs most commands,
          so will have to try and fail each time (and thus. yum will be be much
          slower). If it is a very temporary problem though, this is often a nice
          compromise:
  
              yum-config-manager --save --setopt=amzn-graphics.skip_if_unavailable=true
  
  failure: repodata/repomd.xml from amzn-graphics: [Errno 256] No more mirrors to try.

According to the error message the EC2 instance was not able anymore to download the package amzn-graphics from the repo amzn-graphics-Base. To be exactly it couldn’t access the repomd.xml file. As you can also see by the URLs of the tried repos, e.g. http://packages.us-east-1.amazonaws.com/2016.09/graphics/efb479739386/x86_64/repodata/repomd.xml the repo is managed by AWS.

After searching for a solutions I found many solutions like trying to clear the yum cache/metadata as described at https://stackoverflow.com/questions/32483036/yum-install-fails-with-http-403-trying-to-access-repomd-xml.

Doing research at the official AWS forum it was supposed that a misconfigure subnet/ACL configuration can be the problem (see https://forums.aws.amazon.com/thread.jspa?threadID=94506). As I said the error raised up from one day to the other without changing anything so I didn’t really believe in this. And additionally as I said on some EC2 instance the bootstraping process worked properly. So pulling from the yum repo didn’t work only sometimes. I tried to find out what the differences between the failed and working instances are. They used the same AMI. To be really really sure I started some instances in the same subnet, some of them worked, some didn’t work.

The solution

As I knew pulling from the AWS managed yum repos is only allowed from within the AWS network (try the link I mentioned above http://packages.us-east-1.amazonaws.com/2016.09/graphics/efb479739386/x86_64/repodata/repomd.xml, you will get an access denied error in your browser) I looked at the EC2 instance public and checked the app again. I recognized that pulling from the repo only didn’t work for EC2 instance having a public IP adress from wihtin the “3.x.x.x” range. Instances using IPS from “18.x.x.x” or “54.x.x.x” worked well. So I contacted the AWS support and at the end the customer service raised an internal ticket and AWS fixed the issue. They thanked for pointing out this issue and answered: “We try our best to make sure that our products are up to date. However, we agree that some minor details may have been missed and deeply regret the same.”

Below you can see an extract of the logfile after this issue was fixed:

[2019-01-21T16:49:40.297Z] INFO  [3394]  - [Initialization/PreInitStage0/PreInitHook/02installpackages.sh] : Completed activity. Result:
  ++ /opt/elasticbeanstalk/bin/get-config container -k python_version
  + PYTHON_VERSION=2.7
  + is_baked python_packages
  + [[ -f /etc/elasticbeanstalk/baking_manifest/python_packages ]]
  + false
  + yum install -y httpd24 gcc44 mysql-5.5 mysql-devel
  Loaded plugins: dkms-build-requires, priorities, update-motd, upgrade-helper
  2 packages excluded due to repository priority protections
  Package httpd24-2.4.25-1.68.amzn1.x86_64 already installed and latest version
  Package gcc44-4.4.6-4.81.amzn1.x86_64 already installed and latest version
  Package mysql-5.5-1.6.amzn1.noarch already installed and latest version
  Package mysql-devel-5.5-1.6.amzn1.noarch already installed and latest version

Although it was AWS failure and I spend some hours to find the root cause I’m still glad to use AWS services 🙂

PS: you can see the IP ranges used by AWS at: https://ip-ranges.amazonaws.com/ip-ranges.json