When developing code for lambda functions deployed as container images you will come across the AWS Lambda Runtime Interface Emulator (RIE). The readme of its corresponding GitHub repo at https://github.com/aws/aws-lambda-runtime-interface-emulator describes how to this tool in Docker Containers. Unfortunately the tool doesn’t support hot code reloading. This means even if you have mounted your source code into your Docker Container the tool (named as aws-lambda-rie) won’t recognize code changes. So either you will restart the container every time you make code changes or find a solution to overcome this issue:
The solution
As I’m not able to see the source code of aws-lambda-rie I can’t modify it. As a consequence I have created a wrapper script which kills and starts aws-lambda-rie regularly. I need to use a wrapper script as I’m using the preconfigured Docker base images from AWS available at https://gallery.ecr.aws/lambda/. In these images aws-lambda-rie is the entrypoint which means if this process is killed for whatever reason the whole container will stop. So restarting is not an option.
Of course I want to only stop and start the aws-lambda-rie when there is no incoming request which is processed currently. That’s why the wrapper script checks for established connections on port 8080 which is the default port aws-lambda-rie is listening on.
Long story short this is the bash code created by myself:
#!/bin/sh

# function which restarts the lambda rie process after checking for established/open connections on port 8080
restart_lambda_rie_process() {
  echo "restart_lambda_rie_process() called"
  while lsof -i tcp:8080 | grep -q "ESTABLISHED" # wait till current lambda invocation is finished
  do
    echo "Lambda request is processed currently. Waiting 5 seconds and retry it again."
    sleep 5
  done

  if ! lsof -i tcp:8080 | grep -q "ESTABLISHED"; then # additional check if there is no lambda invocation running currently
    echo "Now trying to kill lambda rie process."
    PID=$(lsof -t -i:8080)
    if [ -z "$PID" ]
    then
      echo "No PID for lambda rie found!"
    else
      echo "Killing PID $PID"
      kill $PID
      echo "sleeping 5 seconds to wait for process termination..."
      sleep 5
    fi
  else
    echo "Another lambda invocation has been started in the meanwhile. Waiting of terminating the lambda rie process."
    restart_lambda_rie_process
  fi
}

# endless loop keeps container running and restarts lambda rie in regular intervals
while true
do
  if [ $# -ne 1 ]; then
    echo "Entrypoint requires the handler name to be the first argument" 1>&2
    exit 142
  fi
  export _HANDLER="$1"

  RUNTIME_ENTRYPOINT=/var/runtime/bootstrap
  if [ -z "${AWS_LAMBDA_RUNTIME_API}" ]; then
    exec /usr/local/bin/aws-lambda-rie $RUNTIME_ENTRYPOINT &
  else
    exec $RUNTIME_ENTRYPOINT
  fi
  echo "Sleeping 10 seconds to avoid unnecessary process restarts..."
  sleep 10
  restart_lambda_rie_process
done
Sidenotes:
When working with AWS lambda rie I couldn’t find documentation about the parameters supported by the tool aws-lambda-rie itself.
But it looks like you can give it a few parameters and people are working on it, e.g.:
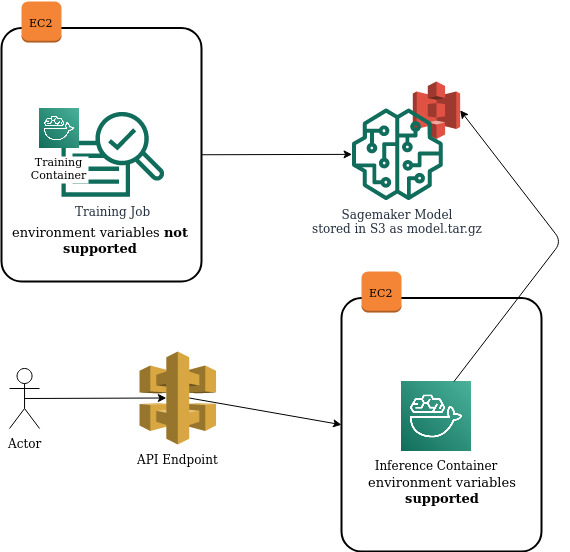
Recently I wanted to use environment variables in a Docker Container which is running a training job on AWS Sagemaker. Unfortunately using environment variables when starting the container is only possible for containers used for inference (which means the model has already been created). In the following diagram I visualized the main components of AWS Sagemaker and at which step environment variables are supported or not.
Environment variables are only supported for Docker containers running as Inference Containers
When you create a training job you can define hyperparameters for tuning the training. Inside the Docker Container it has to be placed at /opt/ml/input/config/hyperparameters.json
The idea of the workaround is to put the content of the environment variables to this file. An example is shown below:
In this example I added two additional parameters called aws_access_key_id and aws_secret_access_key for passing IAM credentials to the container which for example later can be used by the AWS CLI or python script running in the container.
I needed to create a job within a GitLab CI/CD Pipeline which calculates google’s Lighthouse score (https://developers.google.com/web/tools/lighthouse) for a specific website url containing the new code from this pipeline run. The calculated Lighthouse score results should be saved at a presigned AWS S3 url with a limited time to live (ttl). Only if the score is high enough the GitLab CI/CD pipeline should deploy the new code. With this additional step I wanted to avoid increased Lighthouse score on my website caused by the new deployment/release.
The solution
I’m running Lighthouse within a Docker container, so it’s easy to reuse it for other projects. As a starting point I needed chrome running in headless mode. On DockerHub I found this nice container:https://hub.docker.com/r/justinribeiro/chrome-headless/
Based on this container I added some environment variables to adjust Lighthouse and S3 configurations during runtime. This is my Dockerfile:
ENV AWS_ACCESS_KEY_ID: AWS Access Key for storing results in S3
ENV AWS_SECRET_ACCESS_KEY: AWS Secret Key for storing results in S3
ENV AWS_DEFAULT_REGION: AWS Region for S3
ENV AWS_S3_LINK_TTL: Time to live of presigned S3 URL
ENV AWS_S3_BUCKET: Name of S3 bucket containing Lighthouse result
ENV LIGHTHOUSE_SCORE_THRESHOLD: threshold for continuing or aborting GitLab CI/CD Pipeline regarding Lighthouse score
Run lighthouse and save results at presigned S3 URL
After installing all necessary packages the entrypoint bash script run.sh is started. The file is shown below:
#!/bin/bash
FILEPATH=/tmp/lighthouse_score
FILENAME=$(date "+%Y-%m-%d-%H-%M-%S").html
S3_PATH=s3://$AWS_S3_BUCKET/$FILENAME
echo "running lighthouse score against: " $URL
sudo -u chrome lighthouse --chrome-flags="--headless --disable-gpu --no-sandbox" --no-enable-error-reporting --output html --output-path $FILEPATH/$FILENAME $URL
if { [ ! -z "$AWS_ACCESS_KEY_ID" ] && [ "$AWS_ACCESS_KEY_ID" == "EMPTY" ]; } ||
{ [ ! -z "$AWS_SECRET_ACCESS_KEY" ] && [ "$AWS_SECRET_ACCESS_KEY" == "EMPTY" ]; } ||
{ [ ! -z "$AWS_DEFAULT_REGION" ] && [ "$AWS_DEFAULT_REGION" == "EMPTY" ]; } ||
{ [ ! -z "$S3_PATH" ] && [ "$S3_PATH" == "EMPTY" ]; } ;
then
printf "\nYou can find the lighthouse score result html file on your host machine in the mapped volume directory.\n"
else
echo "uploading lighthouse score result html file to S3 Bucket: $S3_PATH ..."
aws s3 cp $FILEPATH/$FILENAME $S3_PATH
if [ ! -z $AWS_S3_LINK_TTL ] && [ $AWS_S3_LINK_TTL == "EMPTY" ];
then
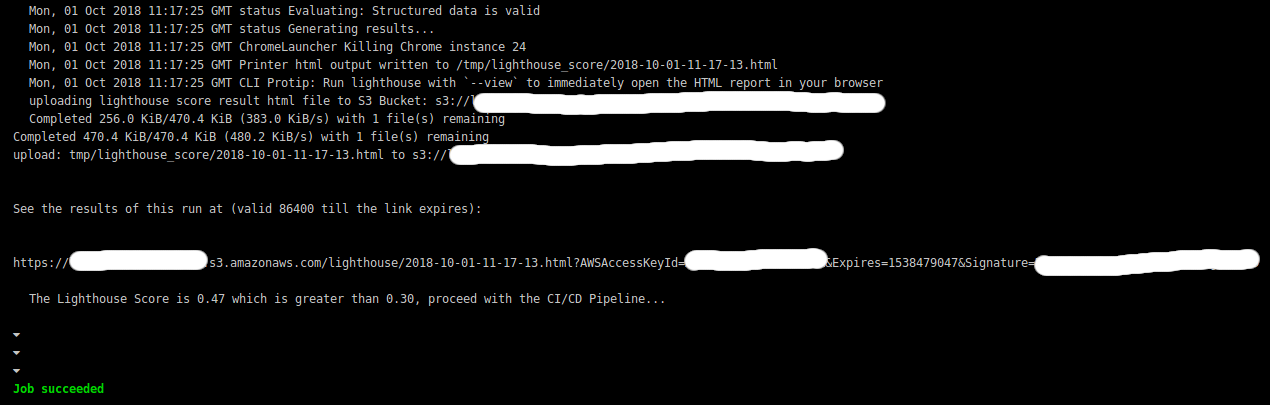
printf "\r\nSee the results of this run at (valid 24hrs (default) till the link expires):\n\n\r"
aws s3 presign $S3_PATH --expires-in 86400
printf "\n"
else
printf "\n\rSee the results of this run at (valid $AWS_S3_LINK_TTL till the link expires):\n\n\r"
aws s3 presign $S3_PATH --expires-in $AWS_S3_LINK_TTL
printf "\n"
fi
fi;
PERFORMANCE_SCORE=$(cat $FILEPATH/$FILENAME | grep -Po \"id\":\"performance\",\"score\":\(.*?\)} | sed 's/.*:\(.*\)}.*/\1/g')
if [ $(echo "$PERFORMANCE_SCORE > $LIGHTHOUSE_SCORE_THRESHOLD"|bc) -eq "1" ];
then
echo "The Lighthouse Score is $PERFORMANCE_SCORE which is greater than $LIGHTHOUSE_SCORE_THRESHOLD, proceed with the CI/CD Pipeline..."
exit 0
else
echo "The Lighthouse Score is $PERFORMANCE_SCORE which is smaller than $LIGHTHOUSE_SCORE_THRESHOLD, DON'T proceed with the CI/CD Pipeline. Exiting now."
exit 1
fi;
This script does the following:
run Lighthouse in chrome with headless mode
save the results as a html file in the container at /tmp/lighthouse_score using a file name containing the current date
if the environment variables are set, upload the html to the specified S3 bucket and presign the file using the cli command aws s3 presign
extract the performance score from the html file using grep and sed
output a message text to proceed or stop the GitLab Pipeline depending on whether $PERFORMANCE_SCORE > $LIGHTHOUSE_SCORE_THRESHOLD and return the value 0 (proceed with GitLab pipeline) or 1 (don’t proceed with GitLab pipeline)
Integrate it into Gitlab CI/CD Pipeline
The GitLab CI/CD Job in gitlab-ci.yml could look like the following YAML snippet:
If you want you can run the Docker container on your machine and get the results from the container as they are stored at /tmp/lighthouse_score within the container. You have to mount a directory from your host machine to the container using docker volumes. The run statement would be:
docker run -it -v /tmp:/tmp/lighthouse_score -e URL=https://allaboutaws.com sh39sxn/lighthouse-signed-s3:latest
You find the lighthouse result on your host machine at /tmp.
There are a many tutorials describing how to auto-scale EC2 instances based on CPU Utilization or Memory Utilization of the host system. Similar approaches can be found to scale ECS Containers automatically based on the CPU/Memory metrics supported by default in ECS (see https://docs.aws.amazon.com/AmazonECS/latest/developerguide/cloudwatch-metrics.html). If your ECS tasks/containers process messages in a SQS queue (e.g. Laravel Queue Workers), you can still use CPU or Memory metrics as an indication for scaling in and out. In my opinion it’s much more reliable and significant if you scale in/out based on the number of messages waiting in the SQS queue to be processed. In this post I’m describing how to do Auto-scaling of ECS Containers based on SQS queue metrics.
Af first I created an IAM User to access and modify the relevant AWS resources. You can use the following IAM policy for this user. Just replace the placeholder for the AWS Region, AWS Account ID, ECS Cluster Name, ECS Service Name and your SQS Queue Name:
At first we need to track the number of messages waiting in the SQS queue to be processed. For this I coded the following bash script:
#!/bin/bash

AWS_ACCOUNT_ID=${1:-123456789}
SQS_QUEUE_NAME=${2:-My-SQS-Queue}
ECS_CLUSTER=${3:-My-ECS-Cluster}
ECS_SERVICE=${4:-My-ECS-Service}
CW_METRIC=${5:-BacklogPerECSTask}
CW_NAMESPACE=${6:-ECS-SQS-Autoscaling}
CW_DIMENSION_NAME=${7:-SQS-Queue}
CW_DIMENSION_VALUE=${8:-My-SQS-Queue}

ApproximateNumberOfMessages=$(aws sqs get-queue-attributes --queue-url https://sqs.$AWS_DEFAULT_REGION.amazonaws.com/$AWS_ACCOUNT_ID/$SQS_QUEUE_NAME --attribute-names All | jq -r '.[] | .ApproximateNumberOfMessages')
echo "ApproximateNumberOfMessages: " $ApproximateNumberOfMessages

NUMBER_TASKS=$(aws ecs list-tasks --cluster $ECS_CLUSTER --service-name $ECS_SERVICE | jq '.taskArns | length')
echo "NUMBER_TASKS: " $NUMBER_TASKS

MyBacklogPerWorker=$((($ApproximateNumberOfMessages / $NUMBER_TASKS) + ($ApproximateNumberOfMessages % $NUMBER_TASKS > 0)))
echo "MyBacklogPerWorker: " $MyBacklogPerWorker

# send average number of current backlogs of the workers as a custom Metric to CloudWatch
aws cloudwatch put-metric-data --metric-name $CW_METRIC --namespace $CW_NAMESPACE \
  --unit None --value $MyBacklogPerWorker --dimensions $CW_DIMENSION_NAME=$CW_DIMENSION_VALUE
In the beginning some variables are defined. You can pass the variables as arguments to the bash script and define default values in case you call the script without arguments. I won’t explain each of them in detail because they should be self-explanatory. The most important points are:
You get the number of messages available for retrieval from the SQS queue via the CLI command get-queue-attributes (see https://docs.aws.amazon.com/cli/latest/reference/sqs/get-queue-attributes.html) Using the json tool jq allows us to easily extract the needed value ApproximateNumberOfMessages from the json formatted result.
The metric ApproximateNumberOfMessages can not be found in the SQS metrics. You only get this value via CLI command. Unfortunately I didn’t find any information how AWS calculates this value. In my impression it’s somehow calculated using the metrics NumberOfMessagesSent and ApproximateNumberOfMessagesVisible which are available via the AWS Management Console, CLI and API.
In the next step we calculate the current backlog of our ECS tasks (in my case called workers as I coded this for Laravel queue workers). ApproximateNumberOfMessages is divided by the current number of running ECS tasks which we get via the command ecs list-tasks. The result is saved in the variable MyBacklogPerWorker and this value is pushed to the custom Cloudwatch Metric via the CLI Command put-metric-data (see https://docs.aws.amazon.com/cli/latest/reference/cloudwatch/put-metric-data.html).
I decided to run the bash script every 1 minute via a cronjob (see later section explaining the Docker container).
Calculate Backlogs and Scale in/OUT based on CloudWatch Metrics
I’m using the size of the backlog per task/worker as a threshold for scaling in or out. I defined the variable LATENCY and PROCESSING_TIME. LATENCY is the maximum allowed number of seconds till a message from the SQS queue should be processed (queue delay). PROCESSING_TIME is the average number of seconds an ECS task needs for processing a message from the SQS queue. Deviding those two values defines the allowed backlog per ECS task/worker. In the code snippet below 10 (20/2=10) messages is the maximum of messages one ECS task should need to process.
LATENCY=${1:-20} # maximum allowed latency (seconds) for processing a message
PROCESSING_TIME=${2:-2}  # average number of seconds to process an image
backlog_per_worker_allowed=$(($LATENCY / $PROCESSING_TIME)) # number of messages a worker can process within the allowed latency timeframe
I’m running the second bash script (shown below) every 5 minutes. It will get the custom CloudWatch metric send by the first bash script for the last 20 minutes from now and calculate the average backlog for all currently running ECS tasks. If the average value of the backlog for all currently running ECS tasks is higher than the defined threshold we will scale out.
The whole bash script looks like:
#!/bin/bash

LATENCY=${1:-20} # maximum allowed latency (seconds) for processing a message
PROCESSING_TIME=${2:-2}  # average number of seconds to process an image
ECS_CLUSTER=${3:-My-ECS-Cluster}
ECS_SERVICE=${4:-My-ECS-Service}
CW_METRIC=${5:-BacklogPerECSTask}
CW_NAMESPACE=${6:-ECS-SQS-Autoscaling}
CW_DIMENSION_NAME=${7:-SQS-Queue}
CW_DIMENSION_VALUE=${8:-My-SQS-Queue}
MAX_LIMIT_NUMBER_QUEUE_WORKERS=${9:-200}

ceil() {
  if [[ "$1" =~ ^[0-9]+$ ]]
    then
        echo $1;
        return 1;
  fi
  echo "define ceil (x)
        {if (x<0) {return x/1} \
          else {if (scale(x)==0) {return x} \
            else {return x/1 + 1 }}} ; ceil($1)" | bc
}

backlog_per_worker_allowed=$(($LATENCY / $PROCESSING_TIME)) # number of messages a worker can process within the allowed latency timeframe
echo "backlog_per_worker_allowed: " $backlog_per_worker_allowed

# get backlogs of the worker for the last 10 minutes
export LC_TIME=en_US.utf8
CF_JSON_RESULT=$(aws cloudwatch get-metric-statistics --namespace $CW_NAMESPACE --dimensions Name=$CW_DIMENSION_NAME,Value=$CW_DIMENSION_VALUE --metric-name $CW_METRIC \
 --start-time "$(date -u --date='5 minutes ago')" --end-time "$(date -u)" \
 --period 60 --statistics Average)
echo "CF_JSON_RESULT: " $CF_JSON_RESULT

# sum up the average values of the last 10 minutes
SUM_OF_AVERAGE_CW_VALUES=$(echo $CF_JSON_RESULT | jq '.Datapoints | .[].Average' | awk '{ sum += $1 } END { print sum }')

echo "SUM_OF_AVERAGE_VALUES: " $SUM_OF_AVERAGE_CW_VALUES

# count the number of average values the CW Cli command returned (varies between 4 and 5 values)
NUMBER_OF_CW_VALUES=$(echo $CF_JSON_RESULT | jq '.Datapoints' | jq length)

echo "NUMBER_OF_CW_VALUES: " $NUMBER_OF_CW_VALUES

# calculate average number of backlog for the workers in the last 10 minutes
AVERAGE_BACKLOG_PER_WORKER=$(echo "($SUM_OF_AVERAGE_CW_VALUES / $NUMBER_OF_CW_VALUES)" | bc -l )
echo "AVERAGE_BACKLOG_PER_WORKER: " $AVERAGE_BACKLOG_PER_WORKER

# calculator factor to scale in/out, then ceil up to next integer to be sure the scaling is sufficient
FACTOR_SCALING=$(ceil $(echo "($AVERAGE_BACKLOG_PER_WORKER / $backlog_per_worker_allowed)" | bc -l) )
echo "FACTOR_SCALING: " $FACTOR_SCALING

# get current number of ECS tasks
CURRENT_NUMBER_TASKS=$(aws ecs list-tasks --cluster $ECS_CLUSTER --service-name $ECS_SERVICE | jq '.taskArns | length')
echo "CURRENT_NUMBER_TASKS: " $CURRENT_NUMBER_TASKS

# calculate new number of ECS tasks, print leading 0 (0.43453 instead of .43453)
NEW_NUMBER_TASKS=$( echo "($FACTOR_SCALING * $CURRENT_NUMBER_TASKS)" | bc -l |  awk '{printf "%f", $0}')
echo "NEW_NUMBER_TASKS: " $NEW_NUMBER_TASKS


## we run more than enough workers currently, scale in slowly by 20 %
if [ $FACTOR_SCALING -le "1" ];
then
  NEW_NUMBER_TASKS=$( echo "(0.8 * $CURRENT_NUMBER_TASKS)" | bc -l)
fi;

echo "NEW_NUMBER_TASKS: " $NEW_NUMBER_TASKS

# round number of tasks to int
NEW_NUMBER_TASKS_INT=$( echo "($NEW_NUMBER_TASKS+0.5)/1" | bc )


if [ ! -z $NEW_NUMBER_TASKS_INT ];
    then
        if [ $NEW_NUMBER_TASKS_INT == "0" ];
          then
              NEW_NUMBER_TASKS_INT=1 # run at least one worker
        fi;
        if [ $NEW_NUMBER_TASKS_INT -gt $MAX_LIMIT_NUMBER_QUEUE_WORKERS ];
          then
              NEW_NUMBER_TASKS_INT=$MAX_LIMIT_NUMBER_QUEUE_WORKERS # run not more than the maximum limit of queue workers
        fi;
fi;

echo "NEW_NUMBER_TASKS_INT:" $NEW_NUMBER_TASKS_INT

# update ECS service to the calculated number of ECS tasks
aws ecs update-service --cluster $ECS_CLUSTER --service $ECS_SERVICE --desired-count $NEW_NUMBER_TASKS_INT 1>/dev/null
There have been some issues I want to mention:
I needed to set the environment variable LC_TIME to en_US.utf8 in order to get the right output from the unix commands date -u and date -u –date=’10 minutes ago’ when calling the CLI command aws cloudwatch get-metric-statistics for the last 10 minutes.
I used the tool bc (Basic Calculator) to do math operations like division from floating point numbers
the bash function ceil() at the beginning of the script rounds up floating point number to the next larger integer (if the argument is already an integer, it just returns the argument)
FACTOR_SCALING is calculated by dividing the currently calculated average backlog per ECS task by the allowed backlog per ECS task, it’s rounded up to the next larger integer using the function ceil():
FACTOR_SCALING=$(ceil $(echo "($AVERAGE_BACKLOG_PER_WORKER / $backlog_per_worker_allowed)" | bc -l) )
the new number of ECS tasks is calculated by the product of the FACTOR_SCALING and the currently running number of ECS tasks CURRENT_NUMBER_TASKS:
There is an edge case you have to take care: when FACTOR_SCALING is 1 it means the we run enough ECS tasks at the moment, so we should scale in. Otherwise we would keep running the same amount of ECS tasks forever and would never scale in as FACTOR_SCALING is always at least 1 (see above point, FACTOR_SCALING is rounded up to the next higher integer which means >= 1). In this case I defined to scale in by 20%:
## we run more than enough workers currently, scale in slowly by 20 %
if [ $FACTOR_SCALING -le "1" ];
then
  NEW_NUMBER_TASKS=$( echo "(0.8 * $CURRENT_NUMBER_TASKS)" | bc -l)
fi;
I added a variable MAX_LIMIT_NUMBER_QUEUE_WORKERS which is used as the maximum number of queue workers running at the same time. I’m using this as a security measure in case my script fails somehow and wants to start way to many workers (which could be expensive).
        if [ $NEW_NUMBER_TASKS_INT -gt $MAX_LIMIT_NUMBER_QUEUE_WORKERS ];
          then
              NEW_NUMBER_TASKS_INT=$MAX_LIMIT_NUMBER_QUEUE_WORKERS # run not more than the maximum limit of queue workers
        fi;
after all these calculations we call the AWS CLI command aws ecs update-service to update the ECS service to the new number of ECS tasks, only errors are printed to stdout to avoid the huge default output from this CLI command:
# update ECS service to the calculated number of ECS tasks
aws ecs update-service --cluster $ECS_CLUSTER --service $ECS_SERVICE --desired-count $NEW_NUMBER_TASKS_INT 1>/dev/null
Run the bash Scripts via Cron in a Docker Container
To run the first bash script called publish-Backlog-per-Worker.sh every 1 minute and the second bash script called scaling.sh every 10 minutes I created a Docker container for it (which itself is running as an ECS task). The Dockerfile looks like:
FROM alpine:latest

LABEL maintainer="https://allaboutaws.com"
ARG DEBIAN_FRONTEND=noninteractive

USER root

RUN apk add --update --no-cache \
    jq \
    py-pip \
    bc \
    coreutils \
    bash

# update pip
RUN pip install --upgrade pip

RUN pip install awscli --upgrade

# Configure cron
COPY ./docker/workers/scaling/crontab /etc/cron/crontab

# Init cron
RUN crontab /etc/cron/crontab

WORKDIR /code/
COPY ./docker/workers/scaling/scaling.sh /code/
COPY ./docker/workers/scaling/publish-Backlog-per-Worker.sh /code

COPY ./docker/workers/scaling/entrypoint.sh /etc/app/entrypoint
RUN chmod +x /etc/app/entrypoint
ENTRYPOINT /bin/sh /etc/app/entrypoint

EXPOSE 8080
It’s an alpine container in which the necessary tools jq, bc, coreutils (for command date), bash and aws cli are installed.
The entrypoint file starts the cron daemon:
#!/bin/sh
set -e

crond -f
The file crontab which is copied inside the container (Don’t forget to put a new line at the end of this file! Cronjob needs it!):
I added a logging configuration for CloudWatch Logs. This makes it easier to track and debug the algorithm. Don’t forget to create the CloudWatch log group /ecs/Queue-Worker-Autoscaling before starting the ECS task. Otherwise it will fail because the log group has to exist before you start the ECS task which pushes log to it.
Results
Using an example timeframe I show you how the auto-scaling of ECS containers based on SQS metrics works at the end.
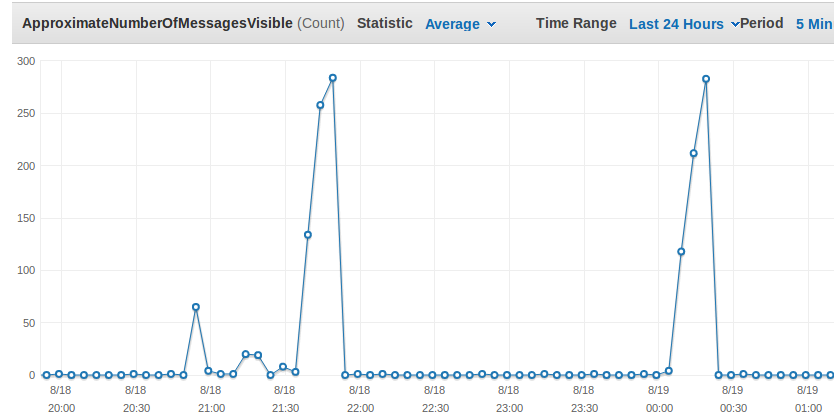
The following screenshot shows the metric ApproximateNumberOfMessagesVisible which is significant for the current workload.
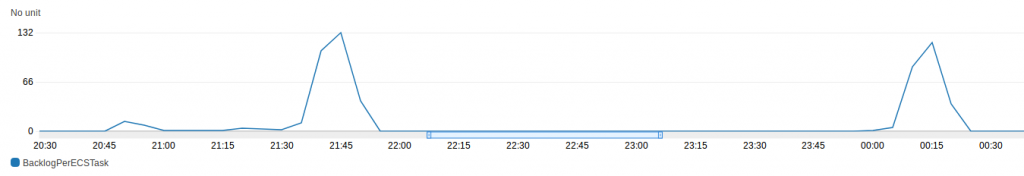
Above you can see two peaks at around 23:50 and 2:20. The custom metric showing the current Backlog per ECS Task fits to it as you see here:
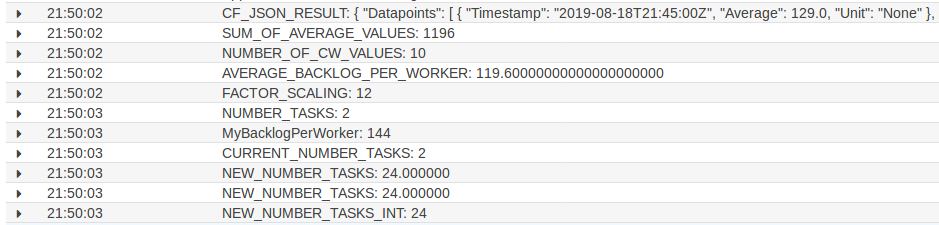
The CloudWatch Logs from the Cronjob ECS Tasks shows that the algorithm recognized that the average backlog per worker is too high and the number of workers is increased from 2 to 24.
Custom Metric BacklogPerECSTask
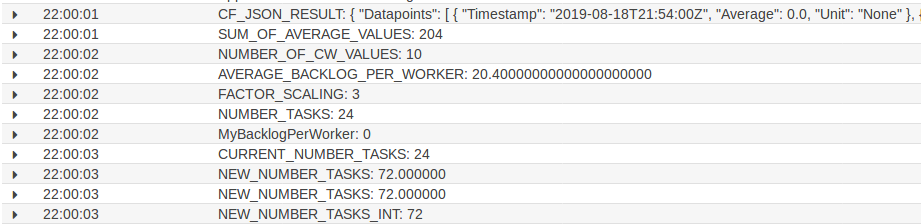
10 minutes later the script checks again the average backlog per ECS Task and again scales in as the it’s still too high:
Custom Metric BacklogPerECSTask
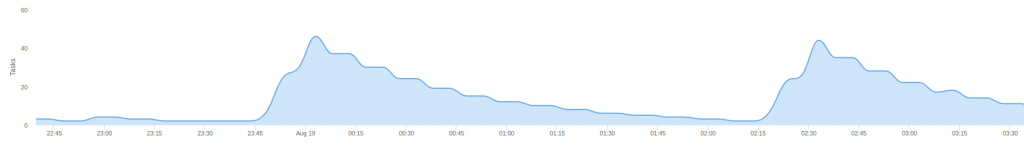
Here you can see a graphical representation of the number of ECS Tasks:
Number of ECS Tasks
You can see how the number of ECS Tasks increased and then descreased in steps by 20% as defined in the bash script.